Image Matrix of Learnt Oligo Functions
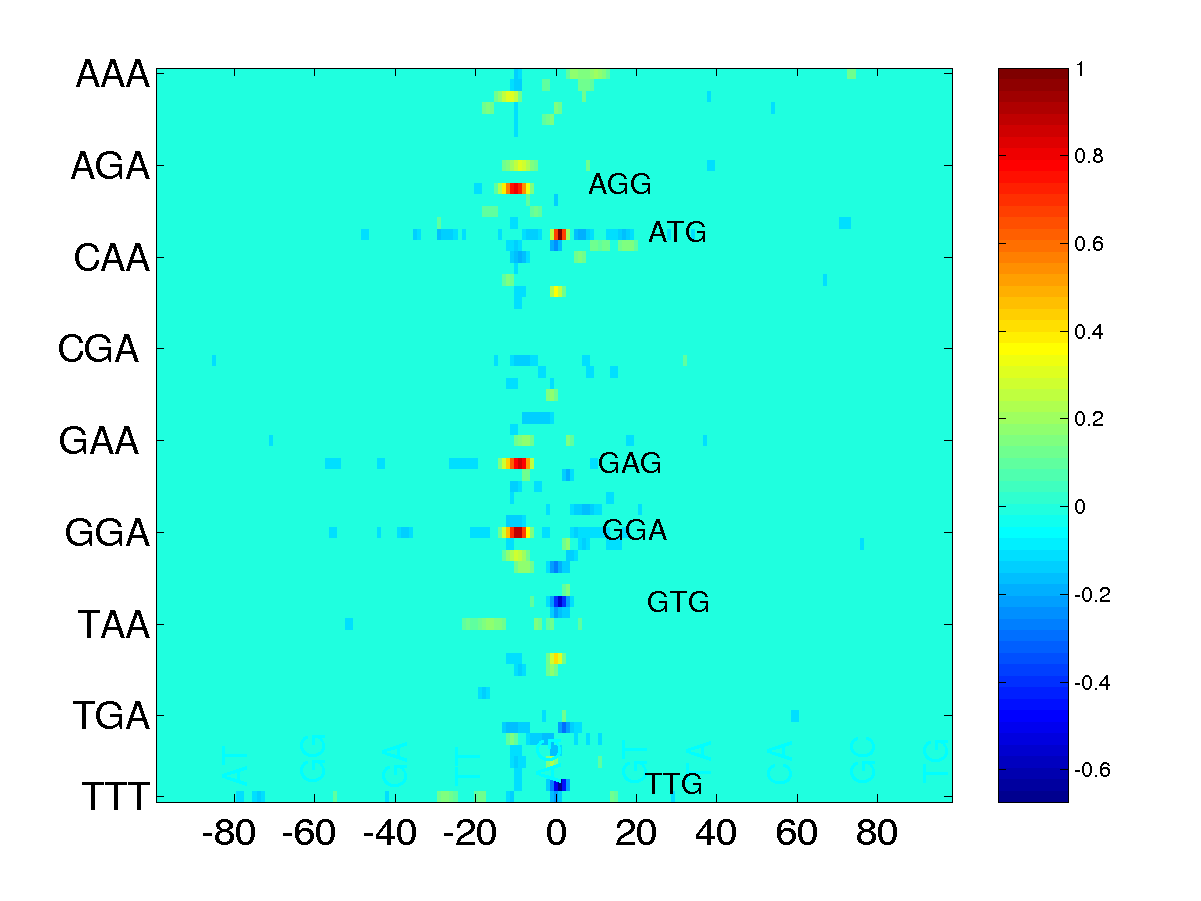
The plot shows the image matrix of learnt oligo functions derived from best performing classifer based on the Trimer Kernel. Each of the 64 lines shows one 3-mer function obtained from an average over 50 runs. Each of the 200 columns corresponds to a certain position with 0 indicating the position of the start codon. The function values are visualized by the color of the corresponding matrix elements. The complete matrix of function values has been scaled to yield a unit maximum which is located at the ATG line at position 0. For noise reduction all matrix elements with an absolute value below 0.1 have been zeroed. The negative peak at position 0 for the TTG-function is due to an overrepresentation of that start codon within the set of negative examples. In general, maxima and minima indicate discriminative features which contribute to the prediction of positive (true) and negative (false) TIS. Note, that the region of discriminative features is rather small and concentrated around the start codon on the left (upstream) side of the image.
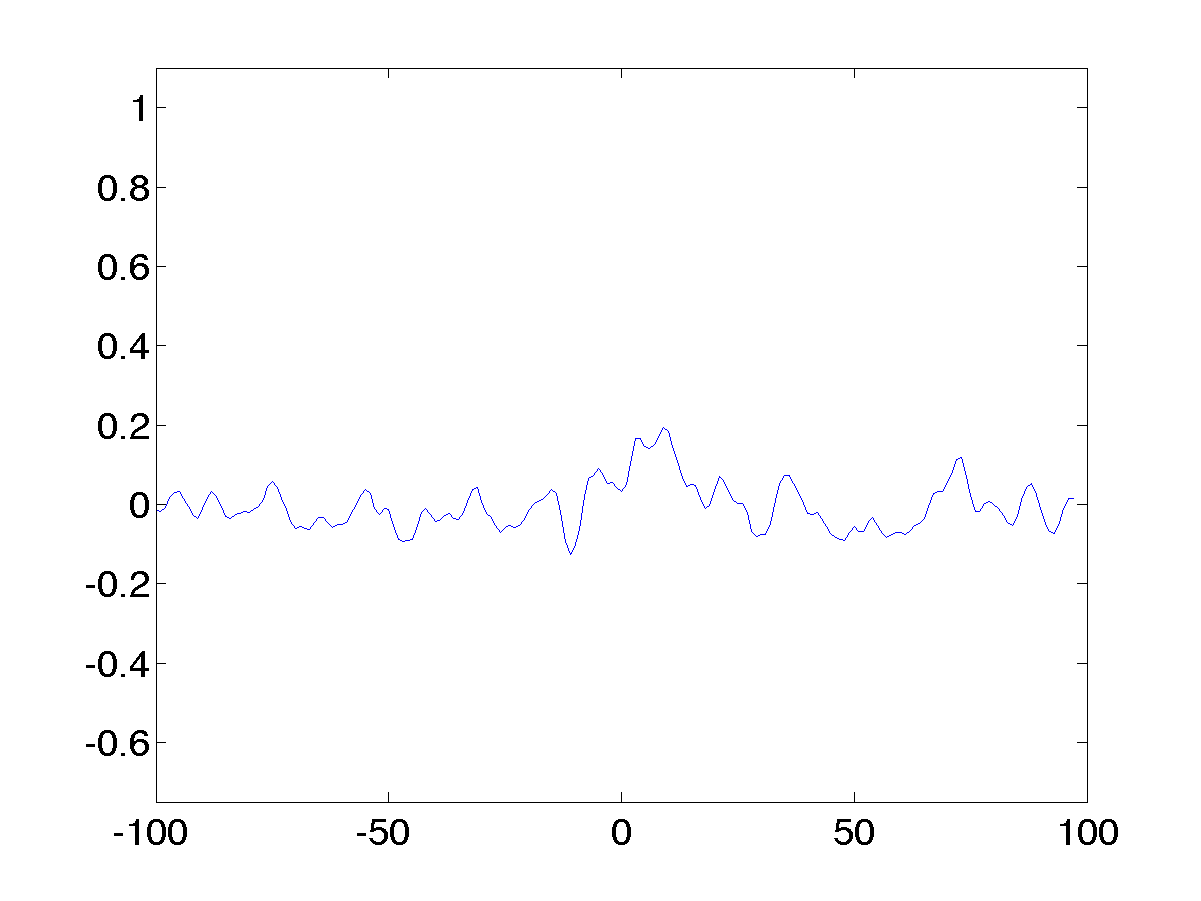
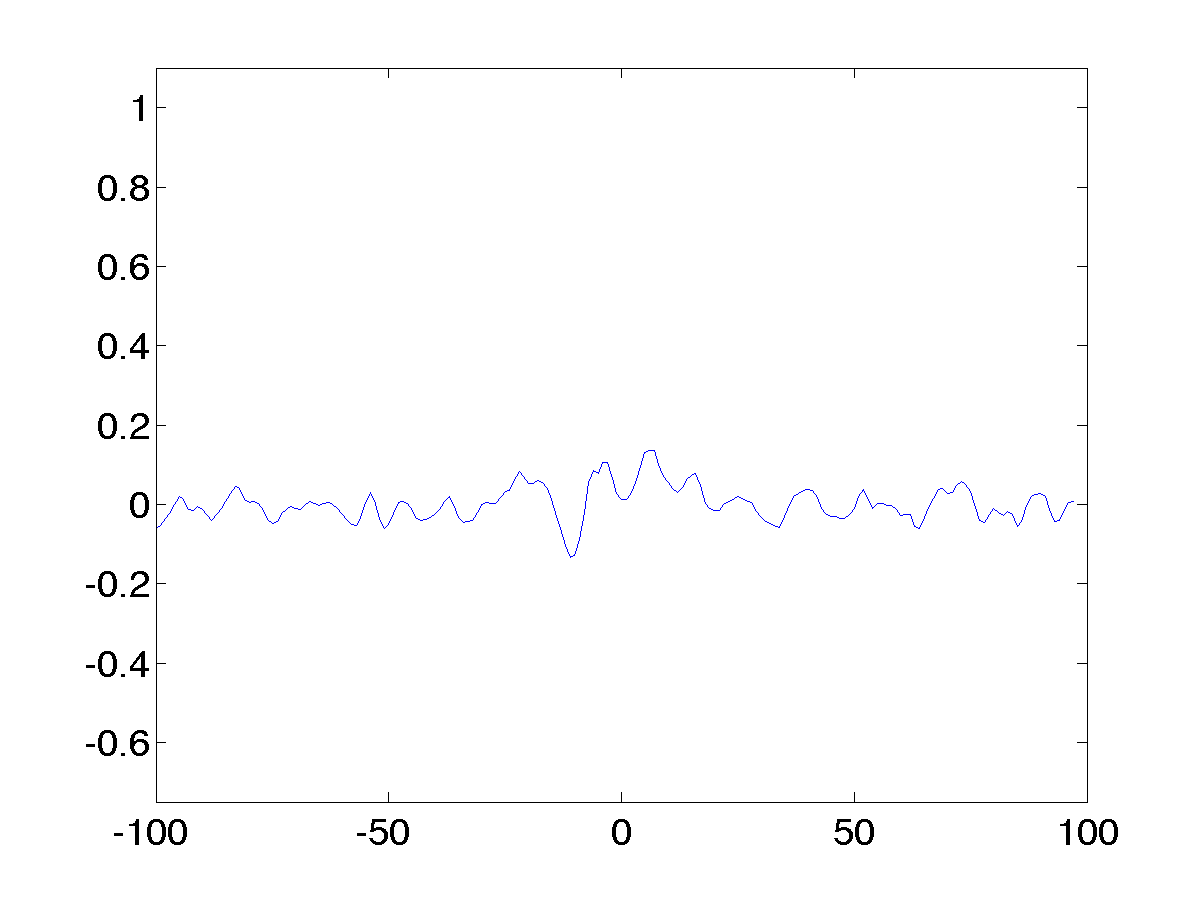
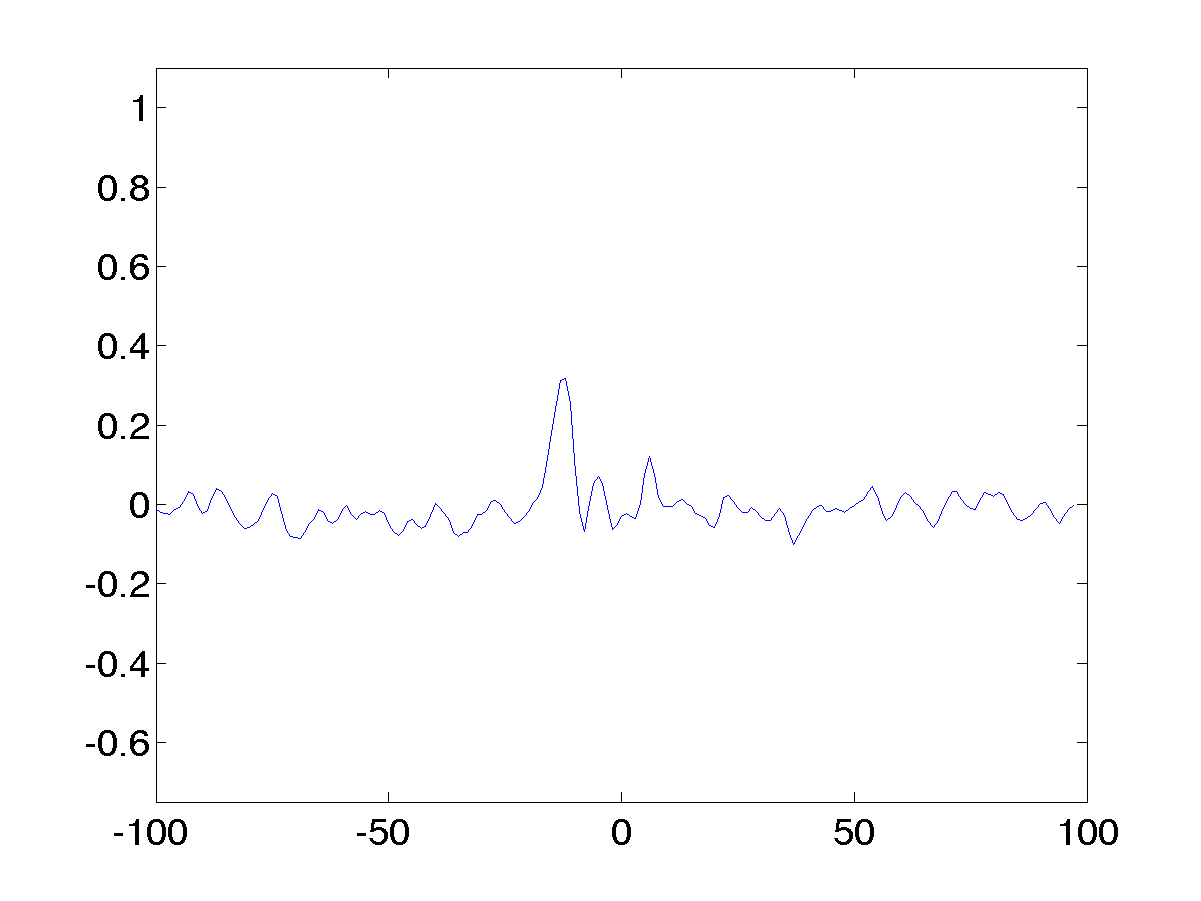
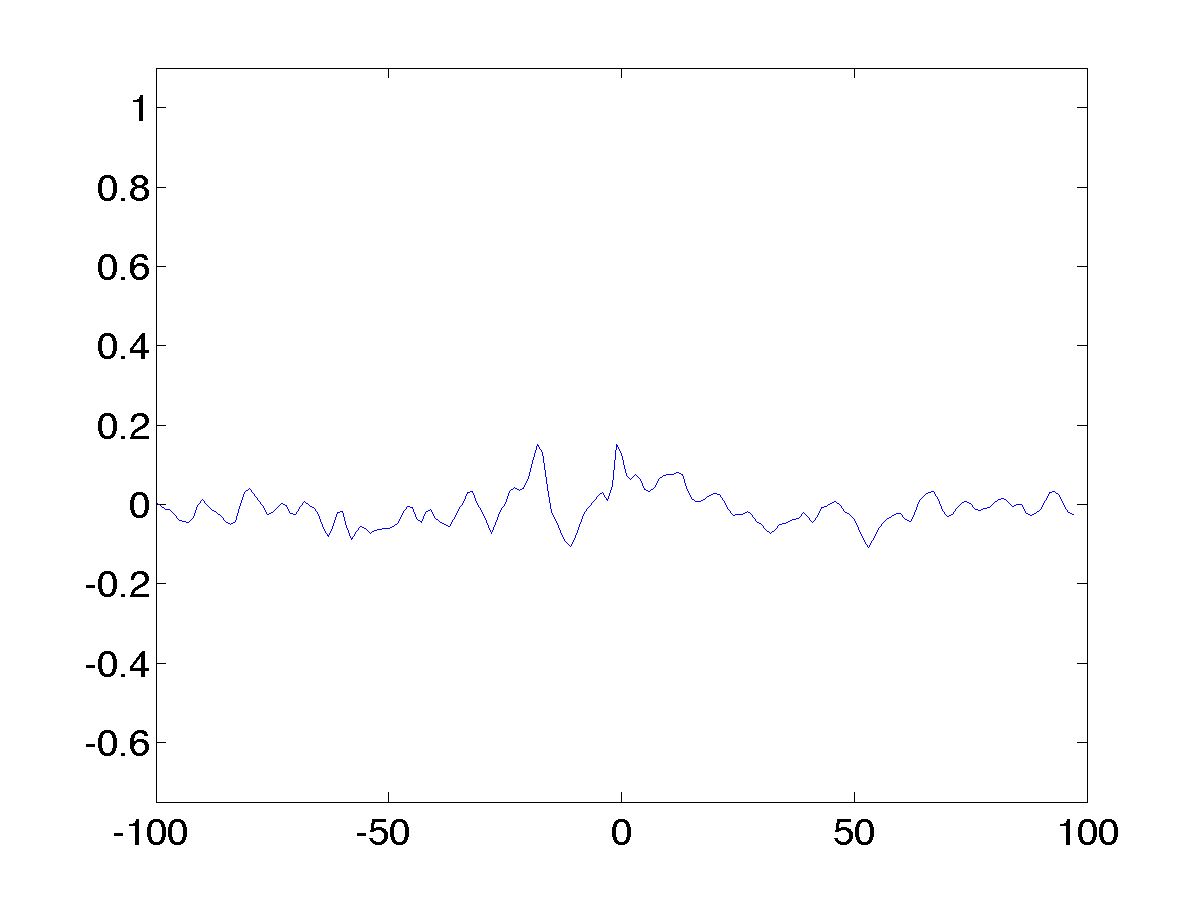
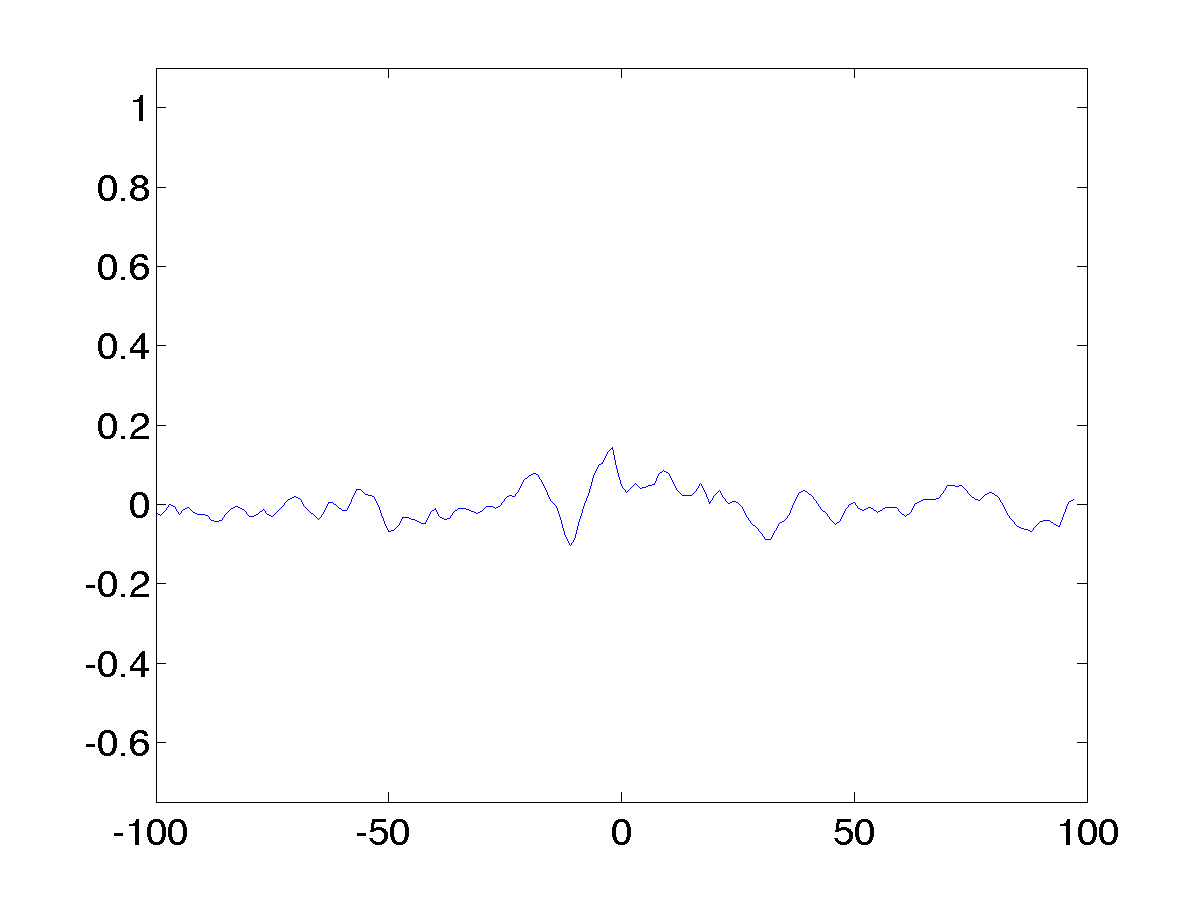
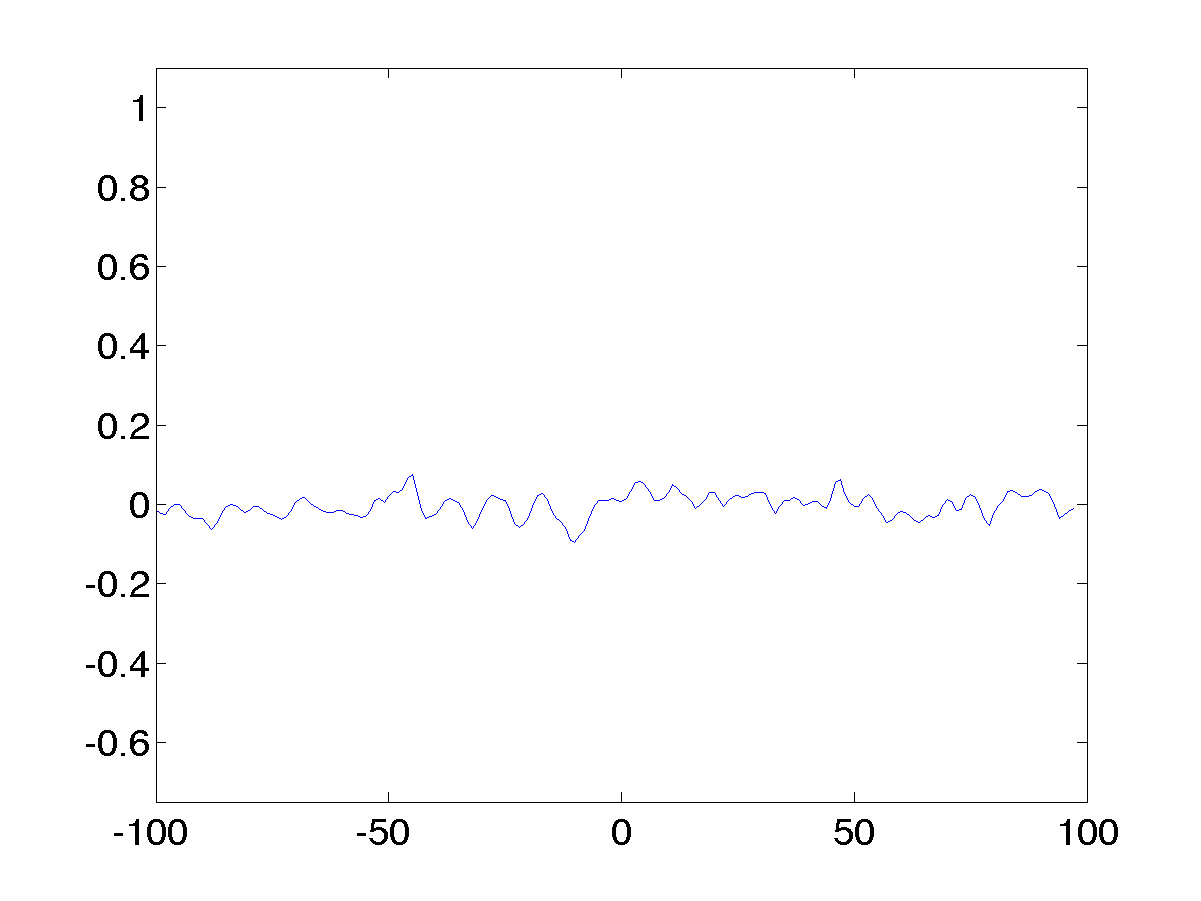
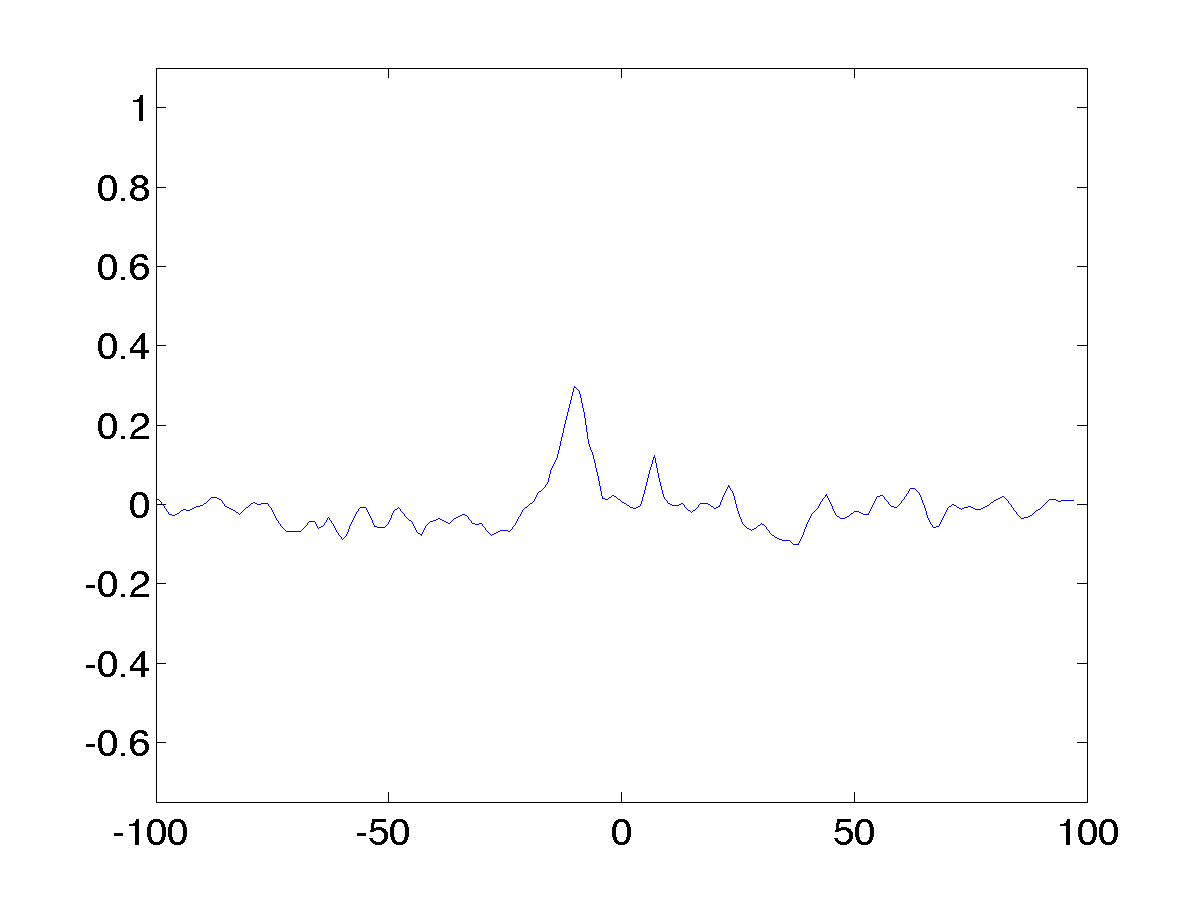
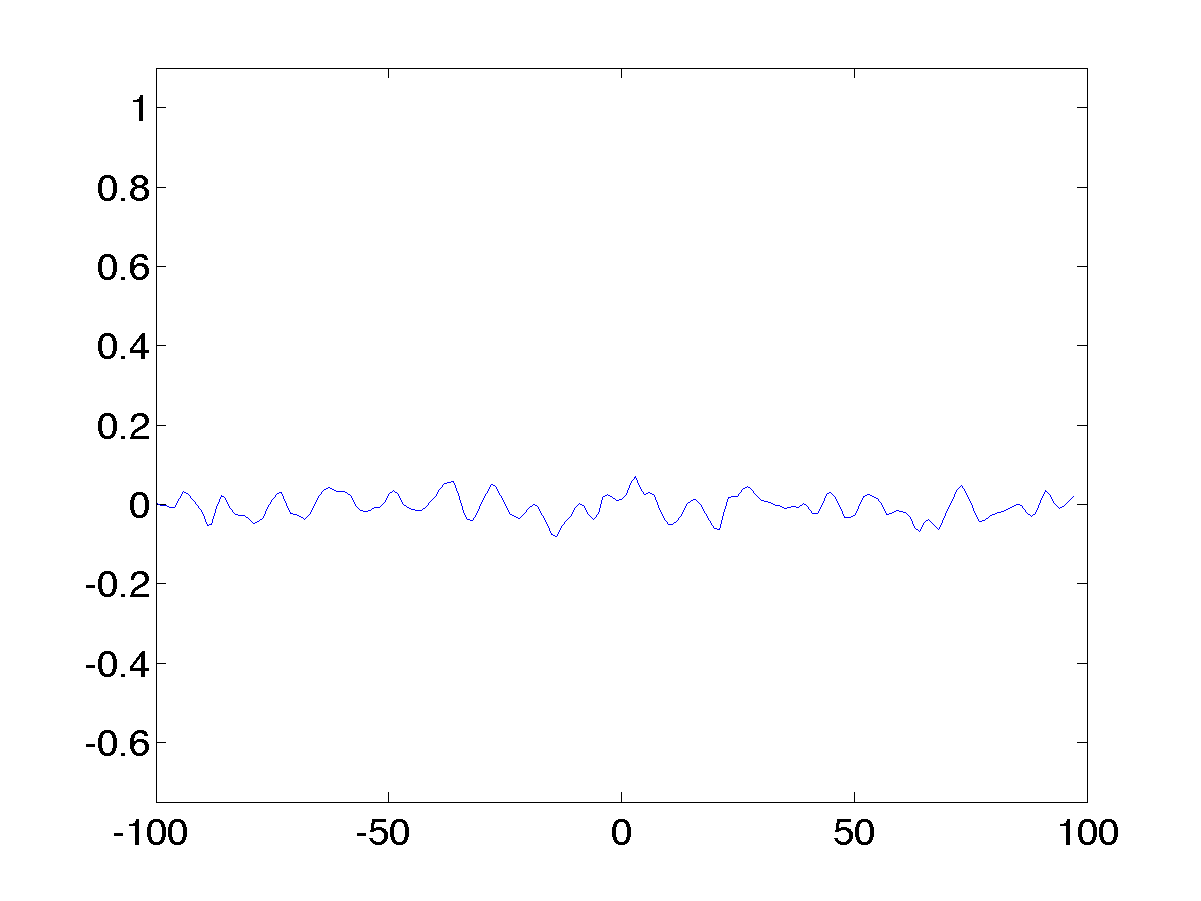
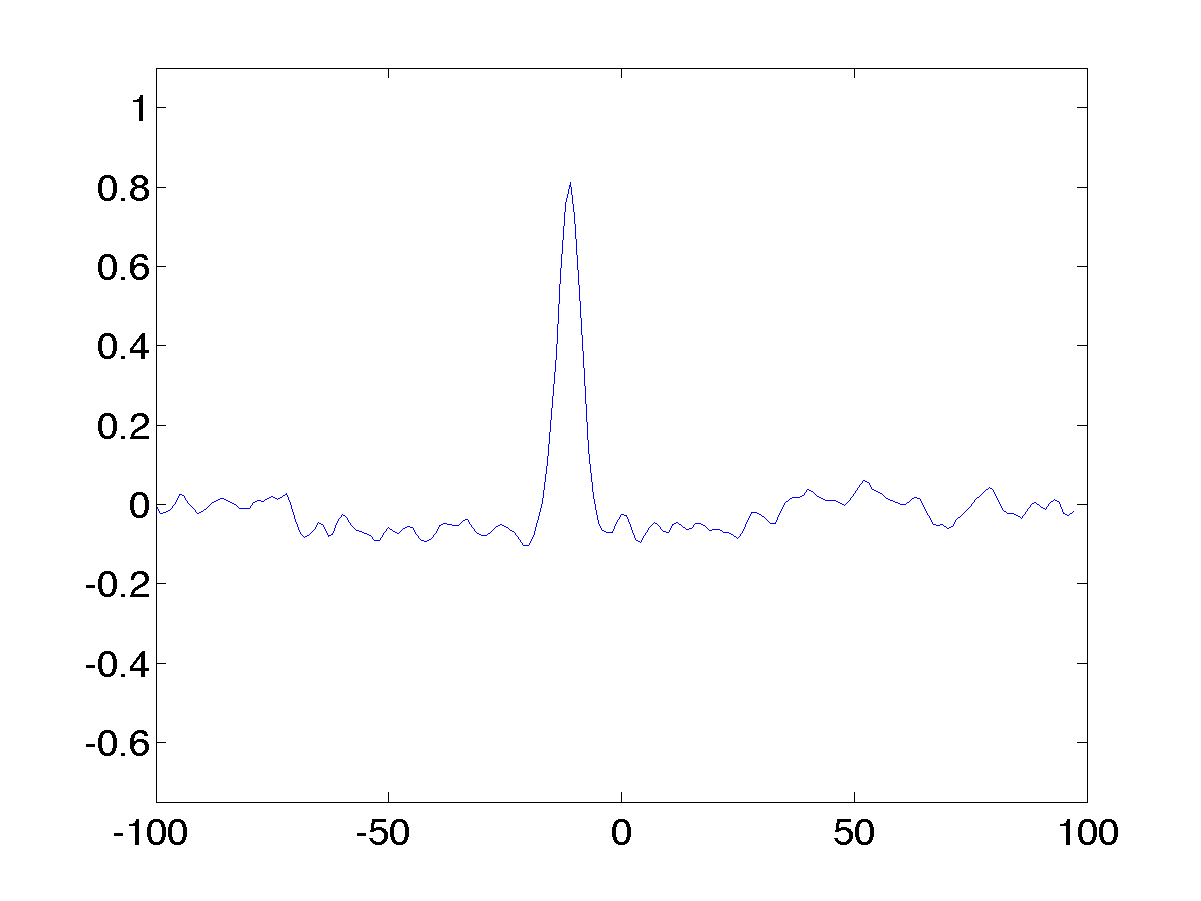
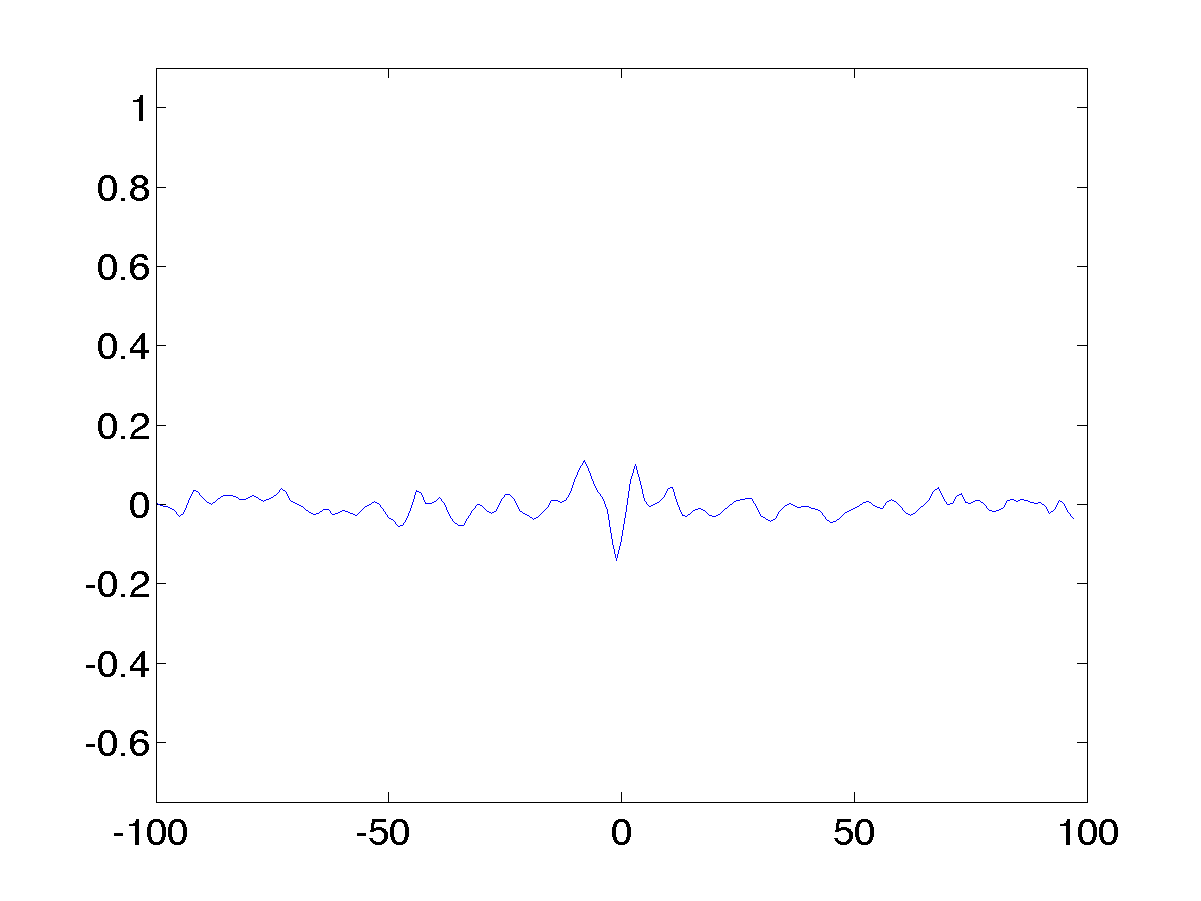
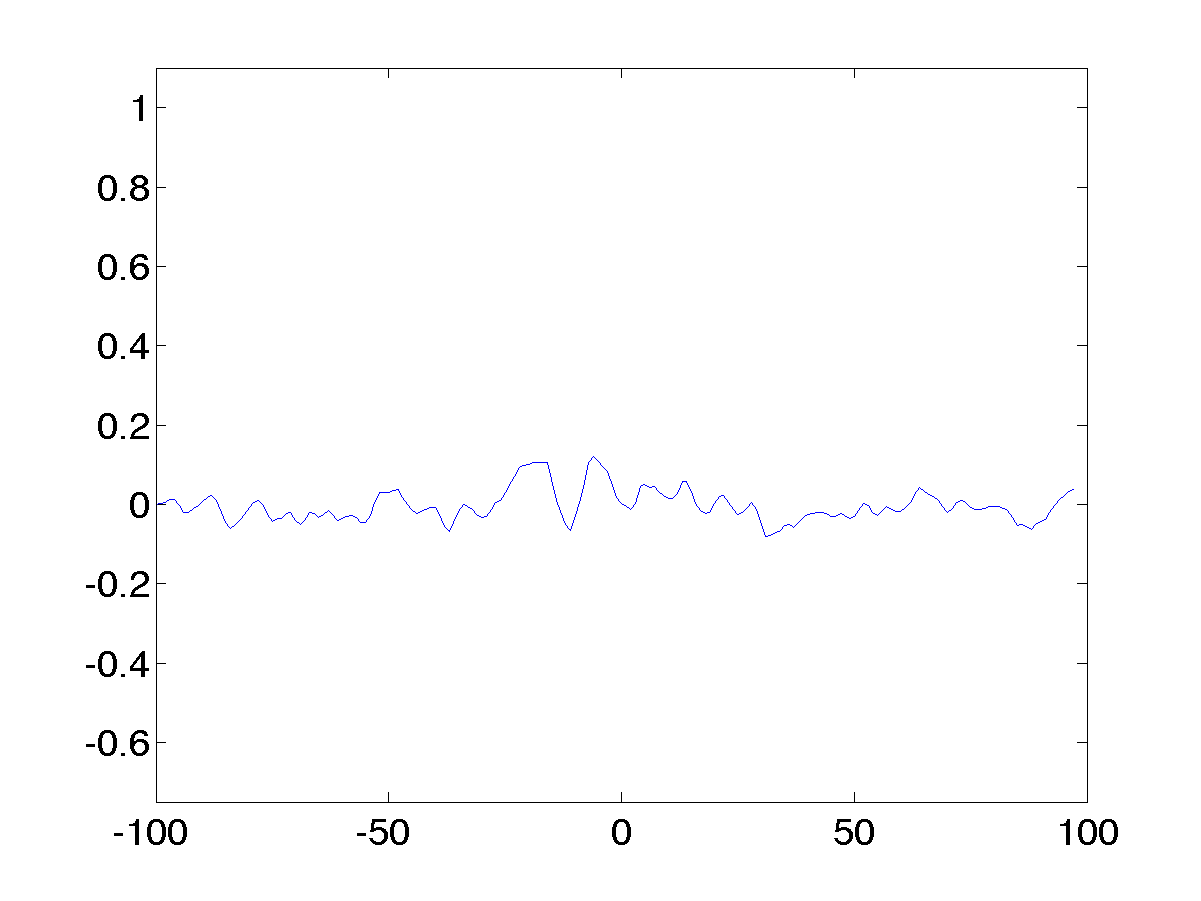
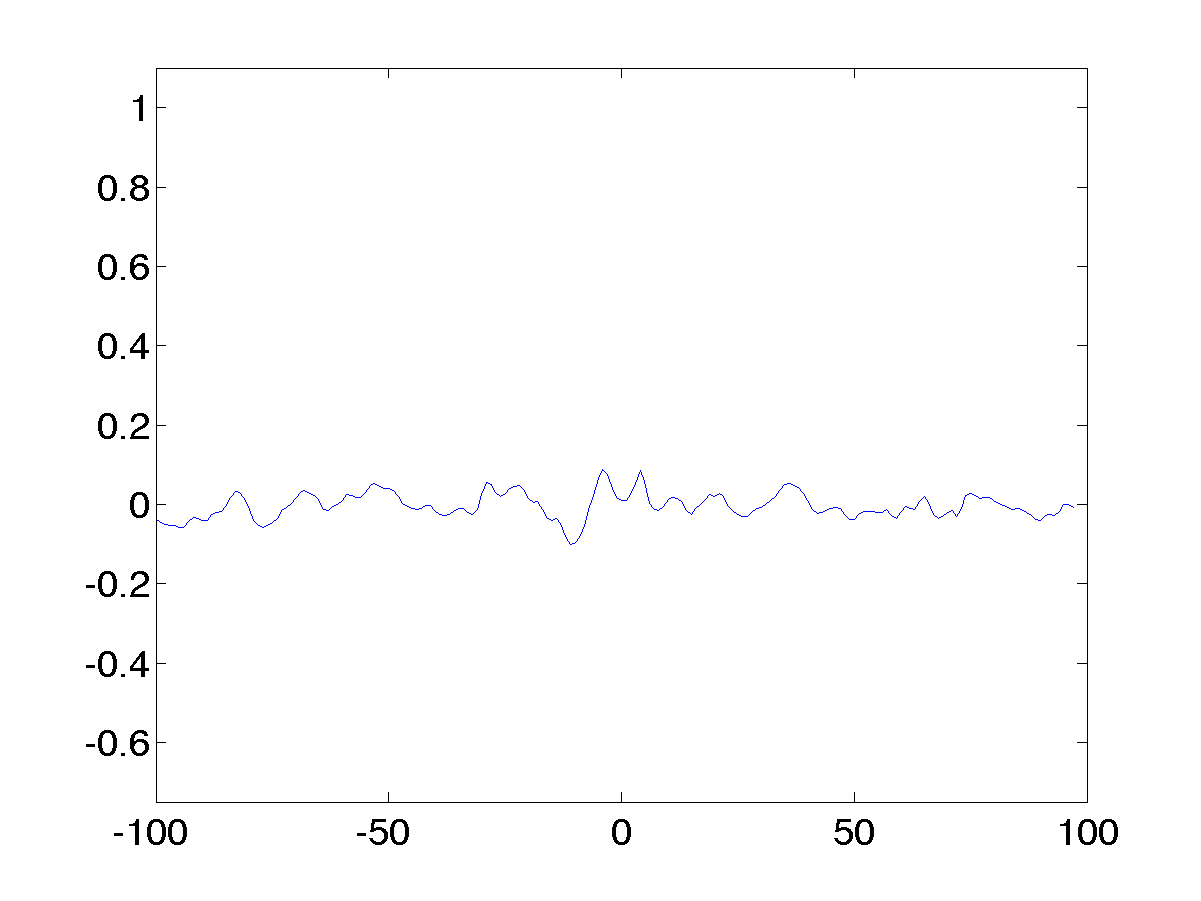
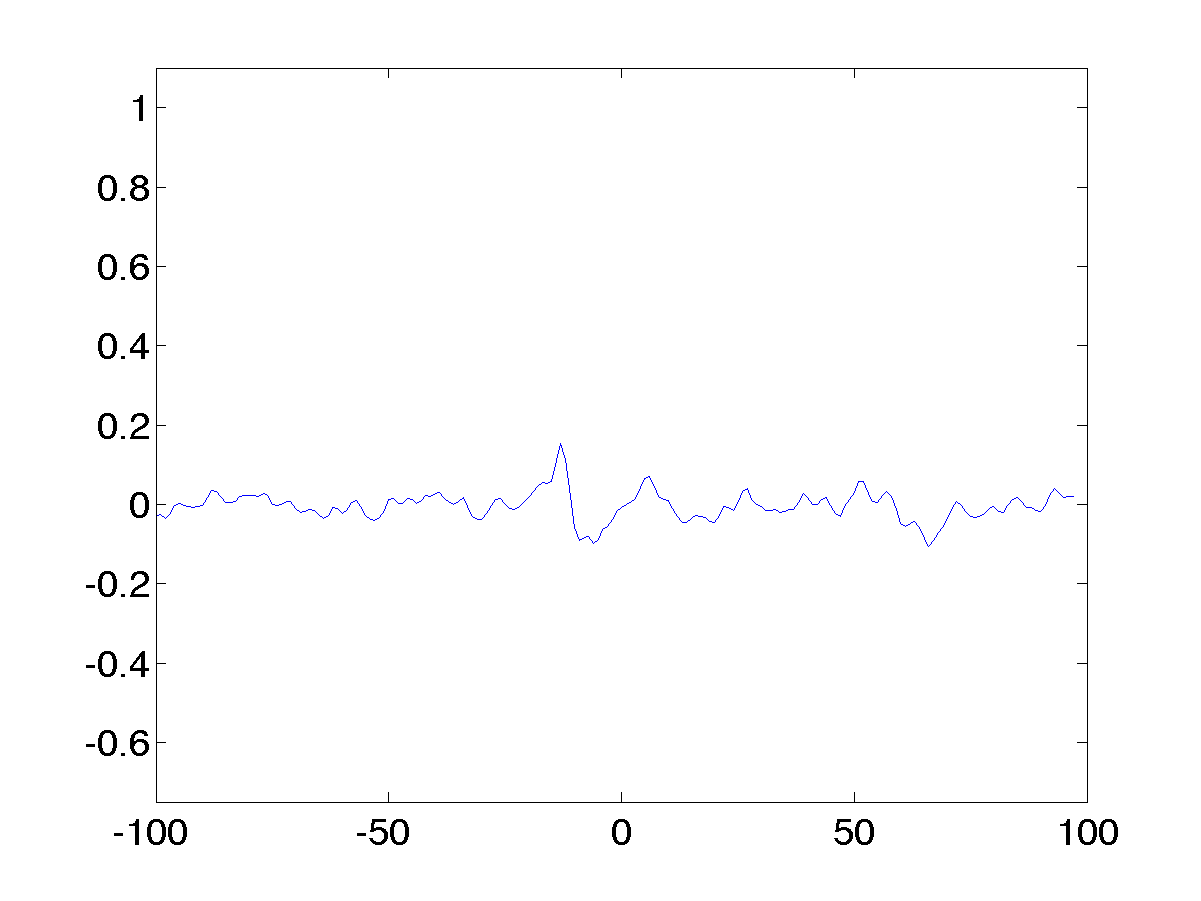
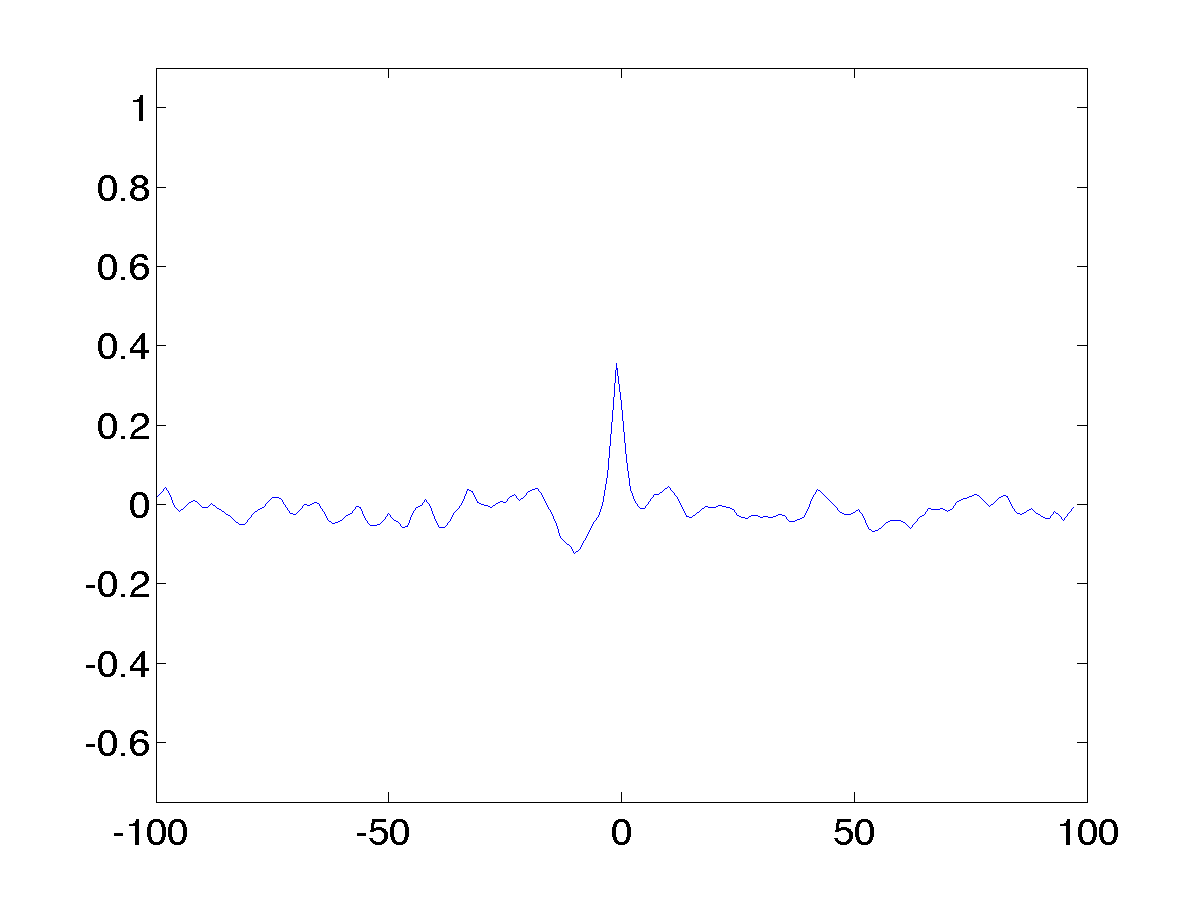
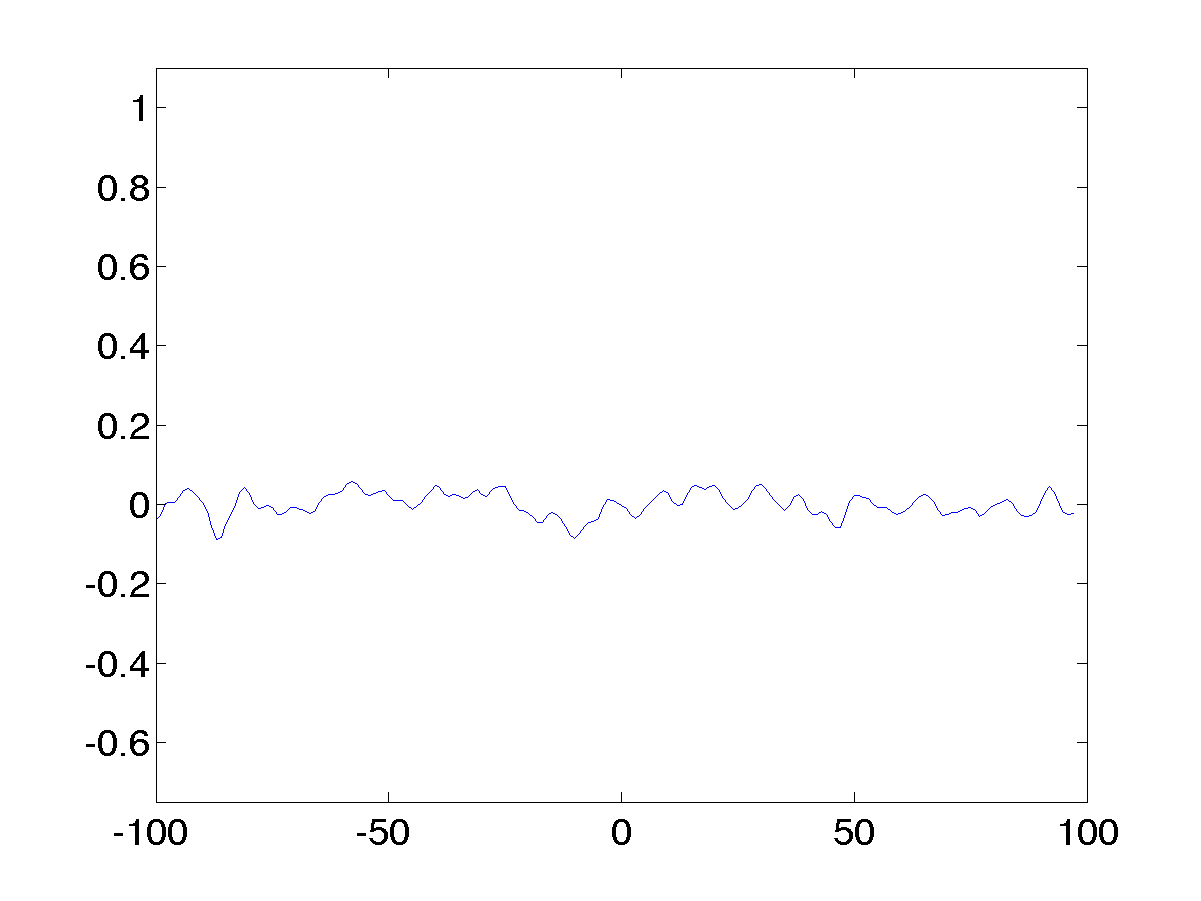
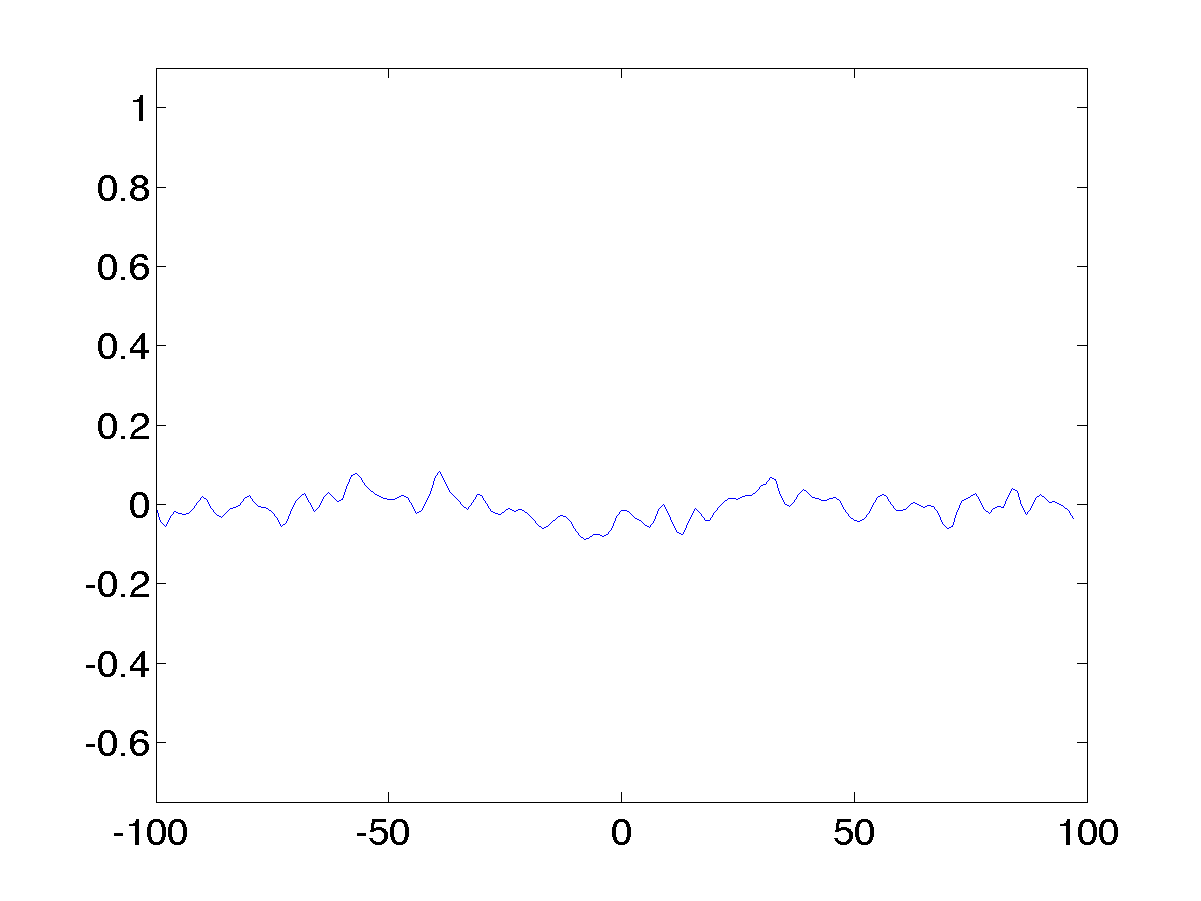
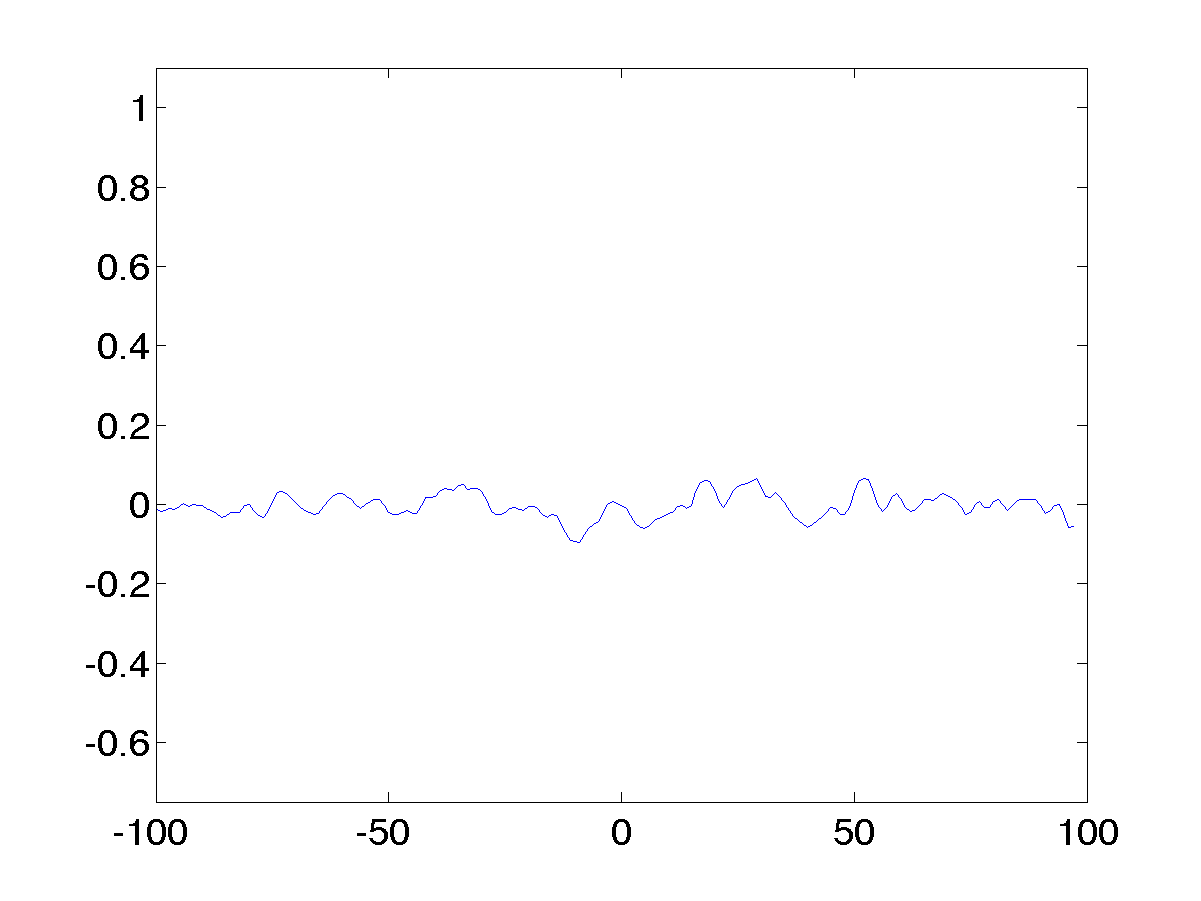
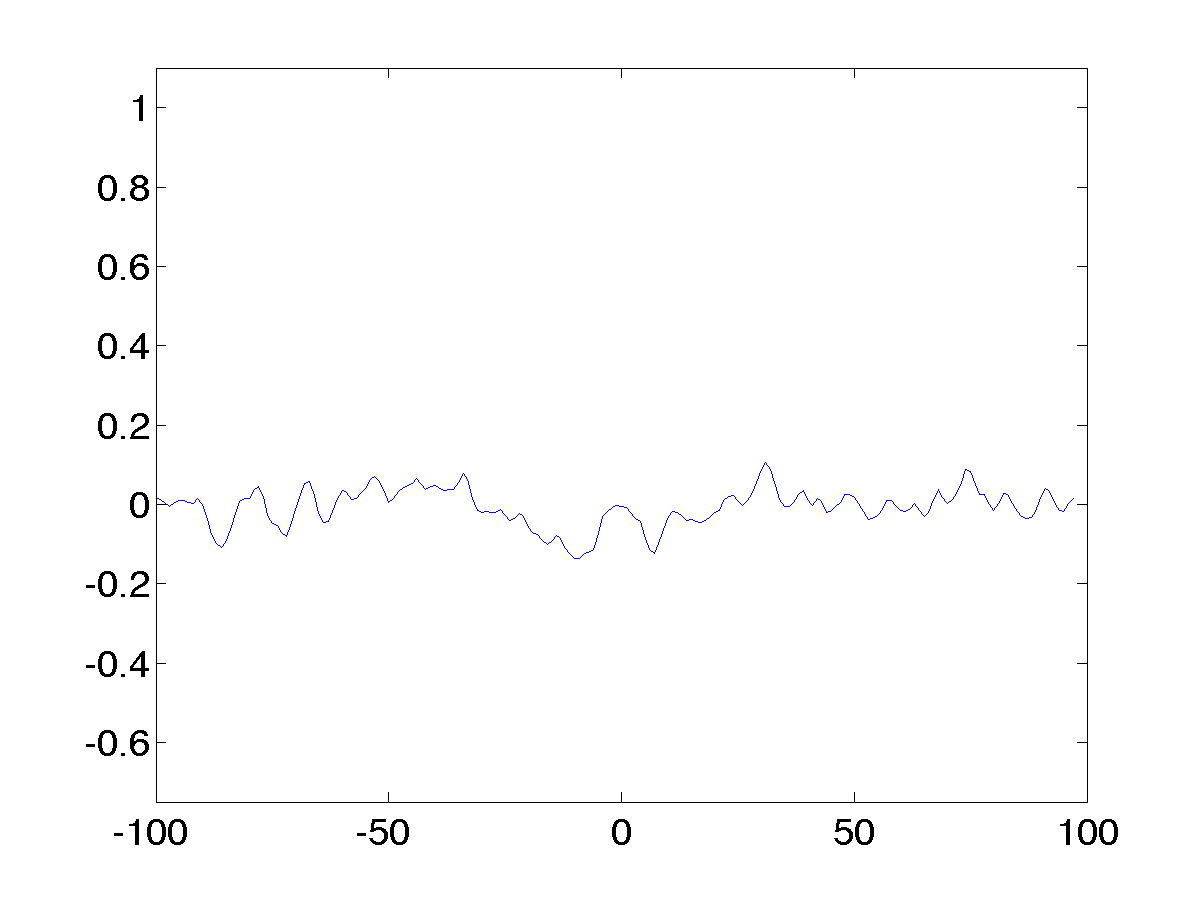
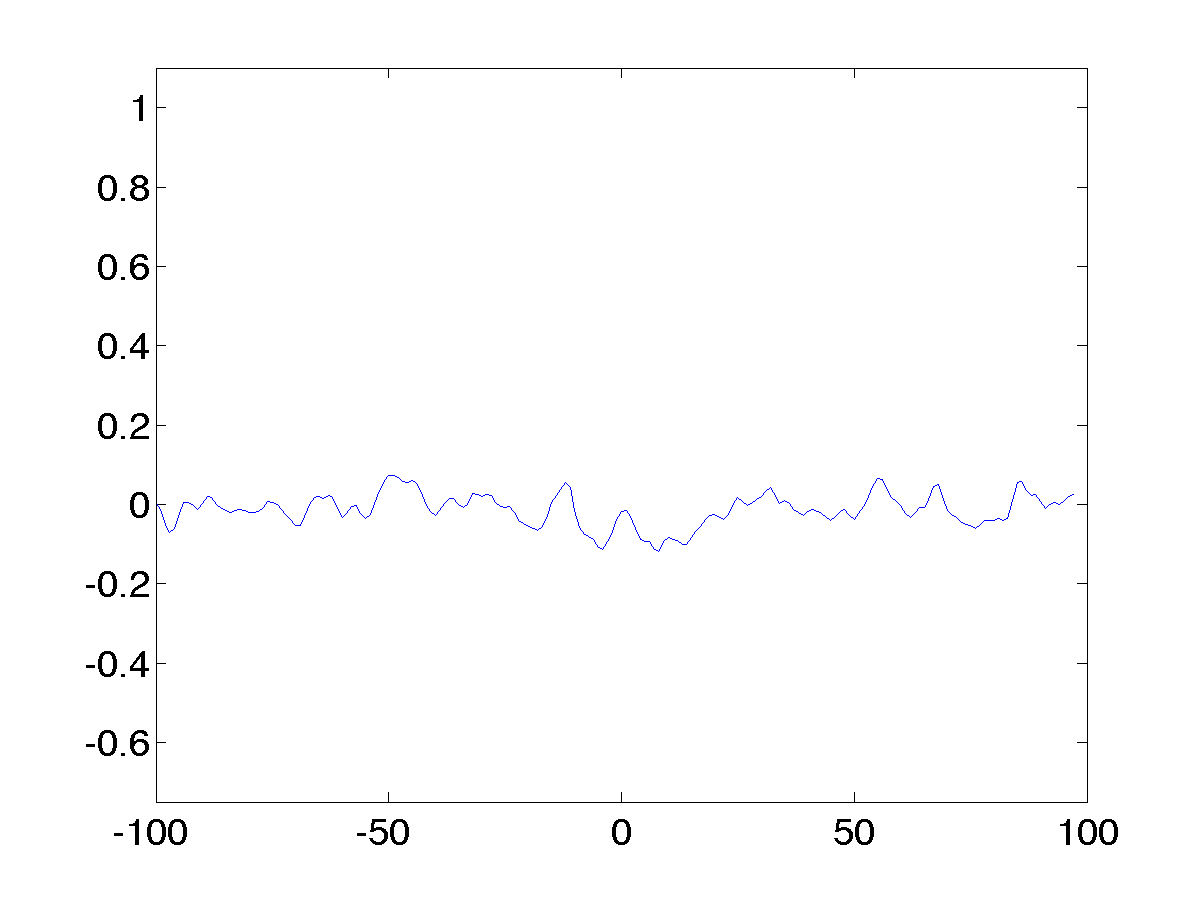
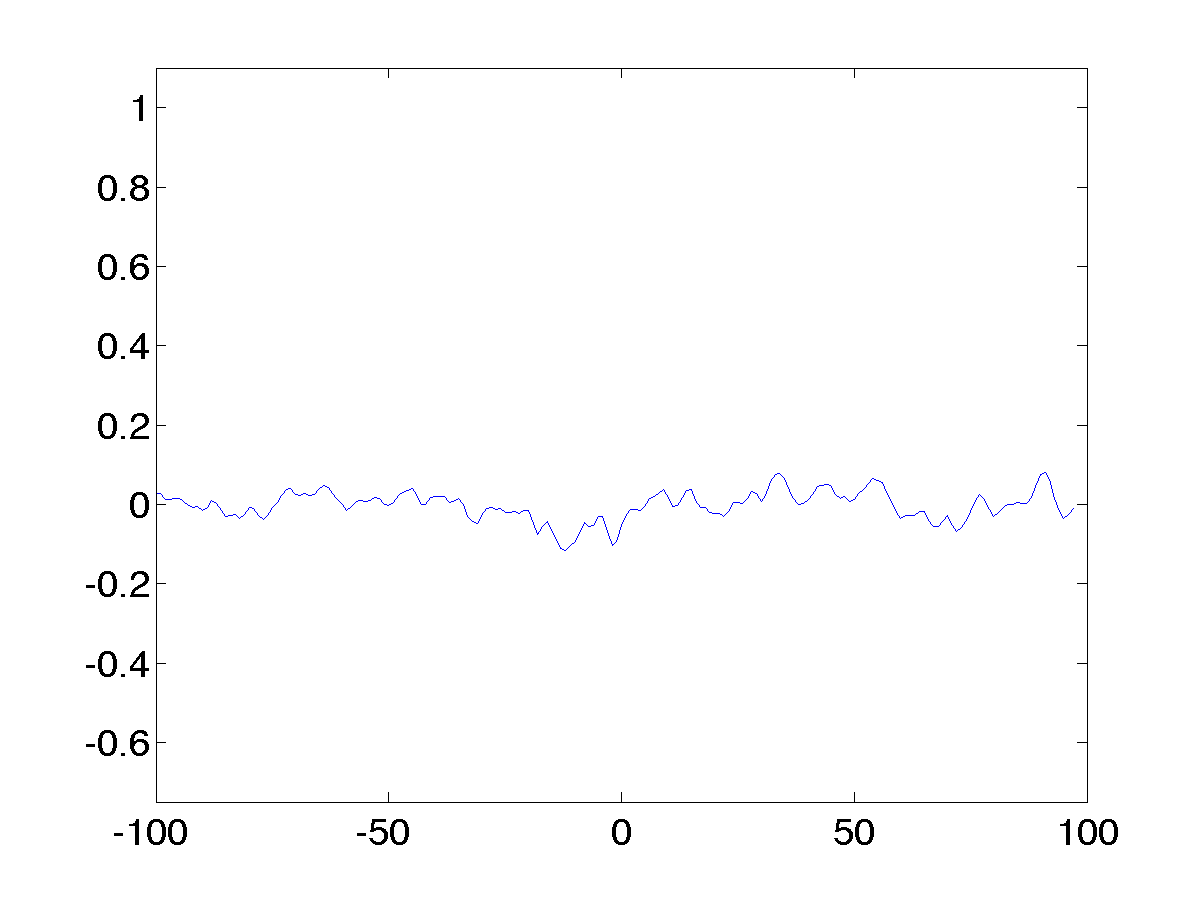
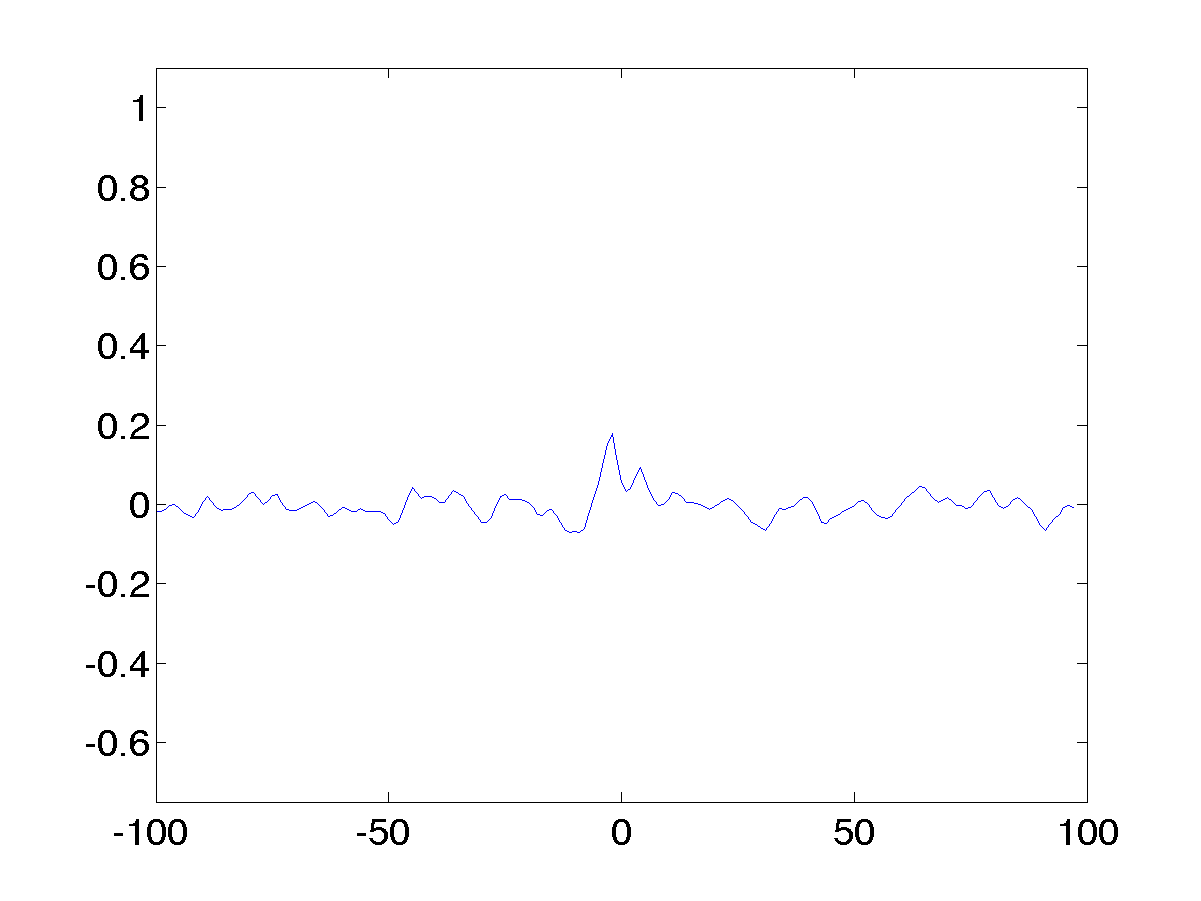
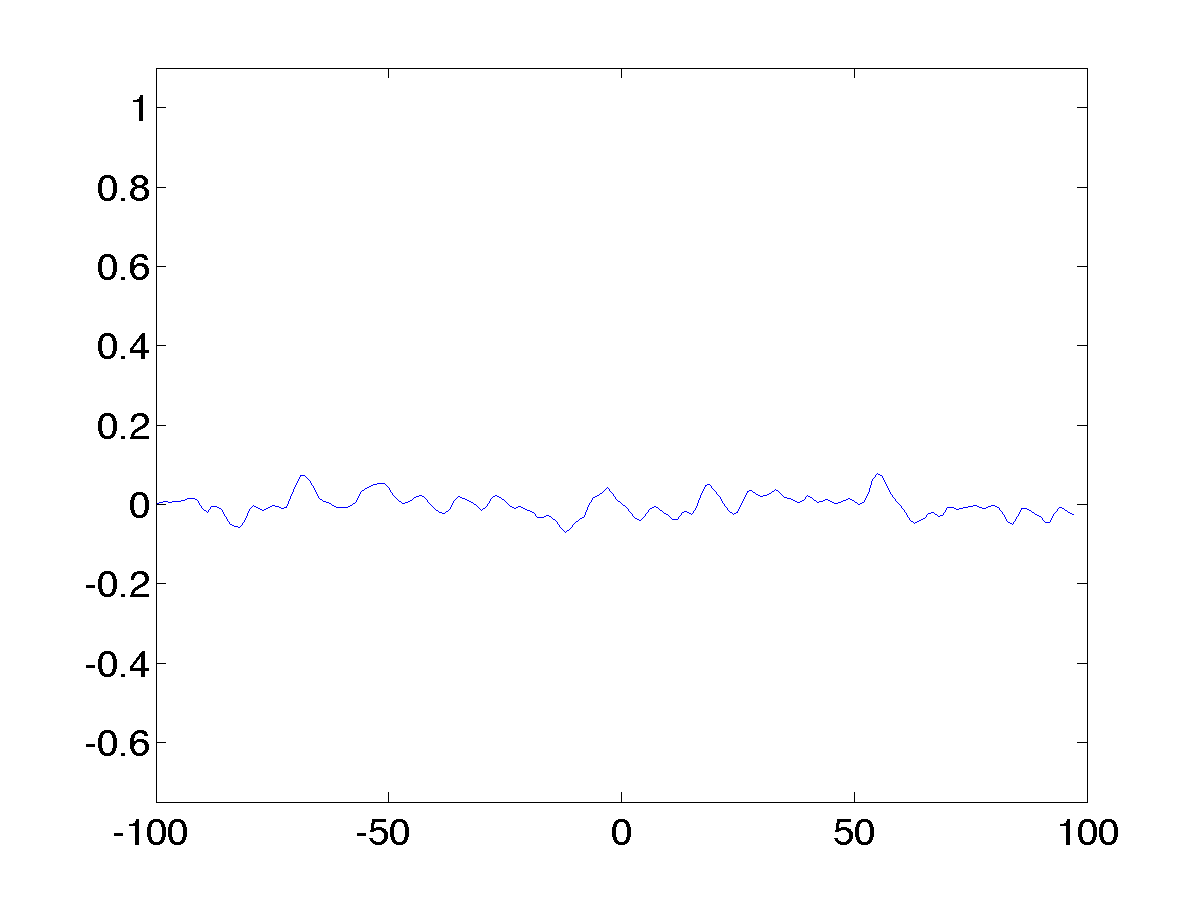
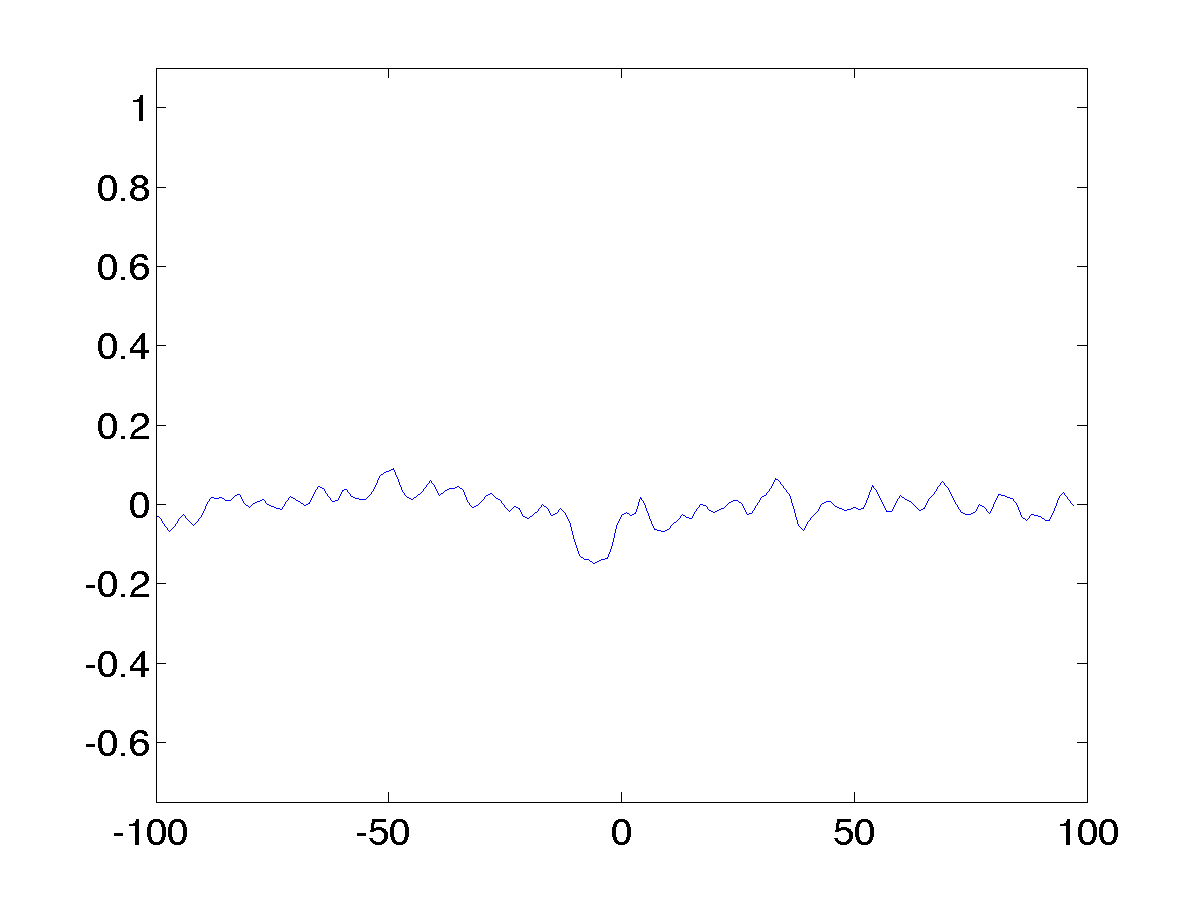
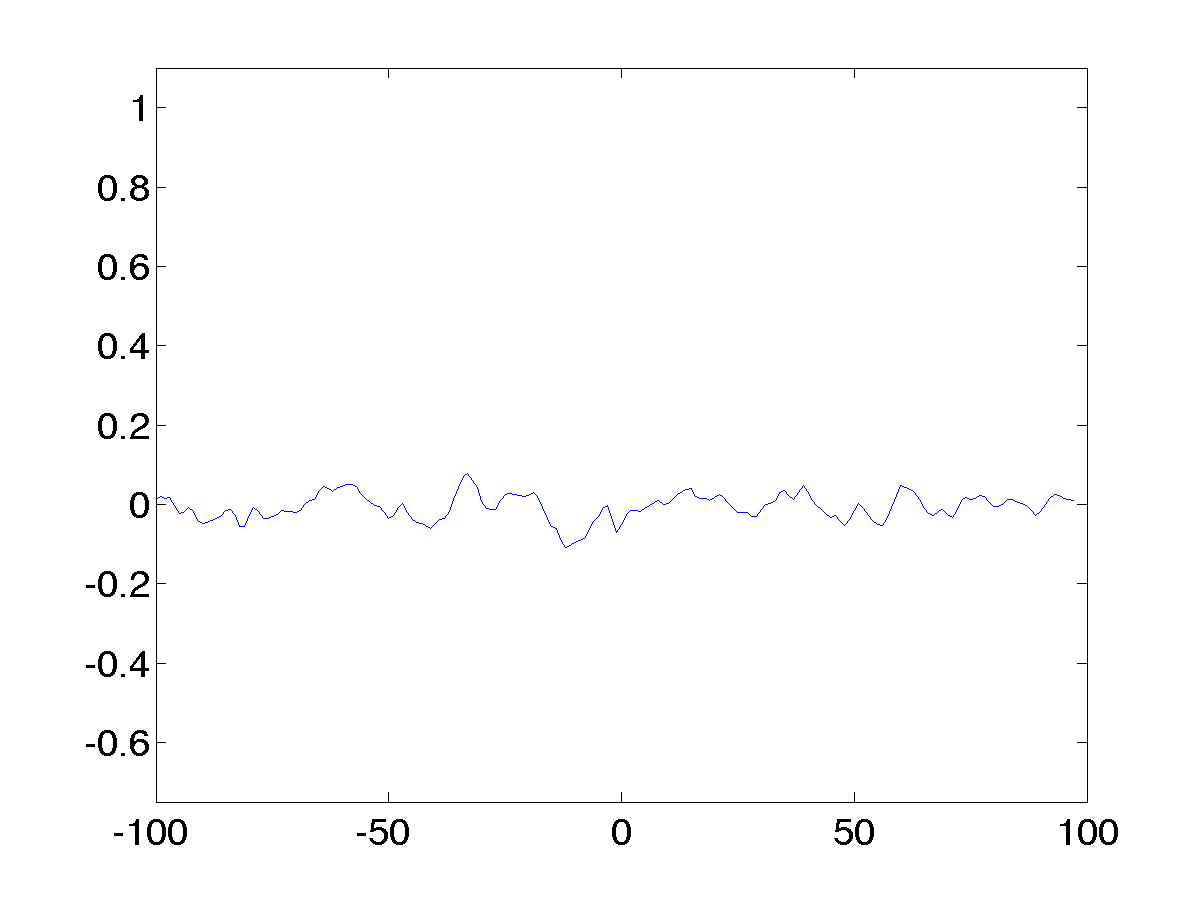
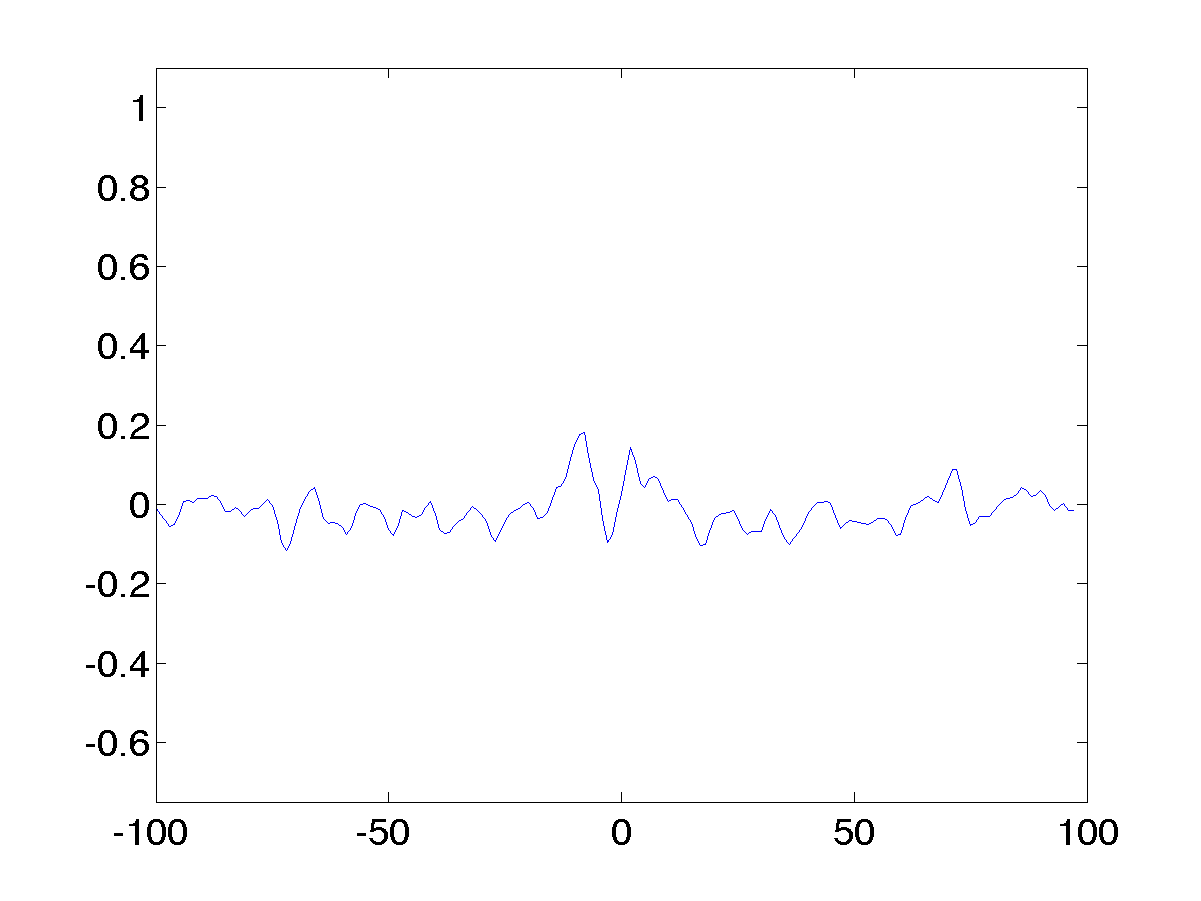
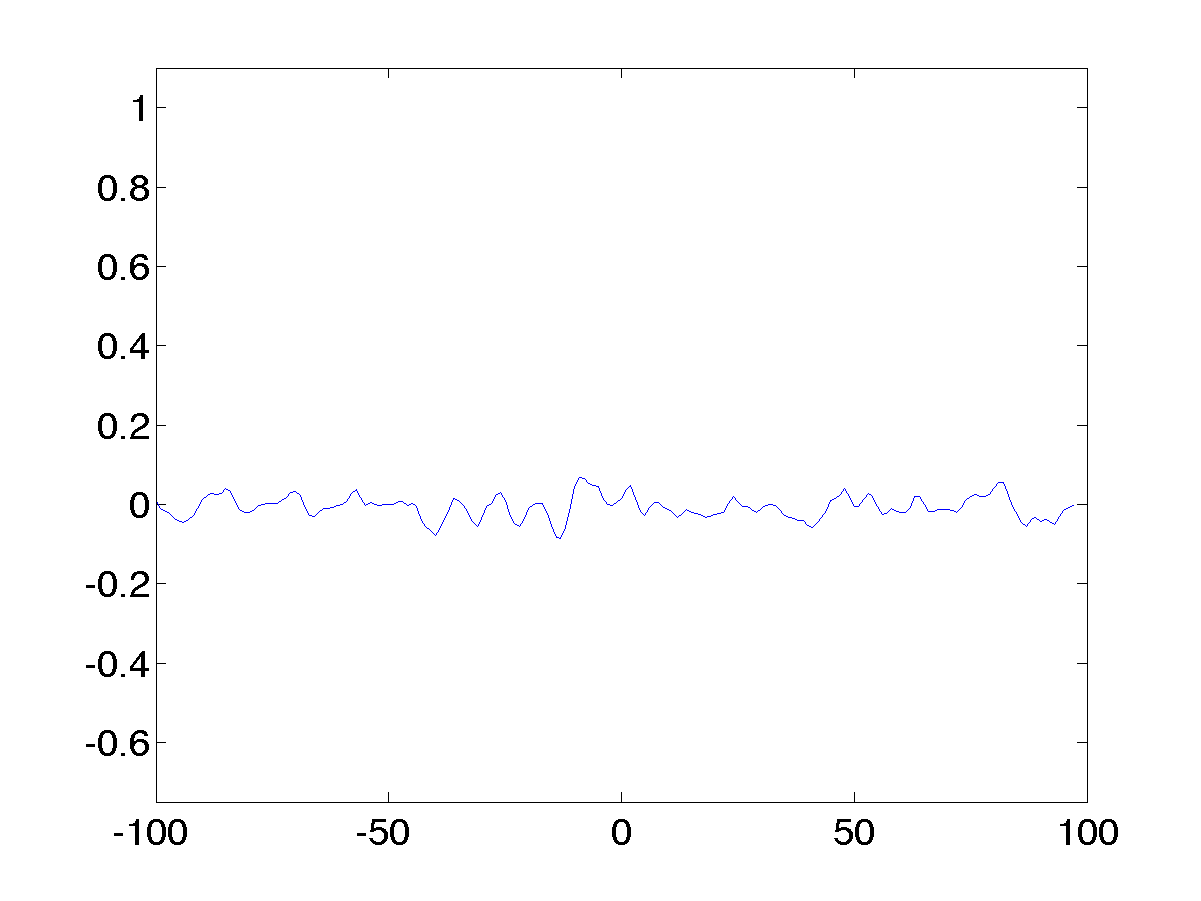
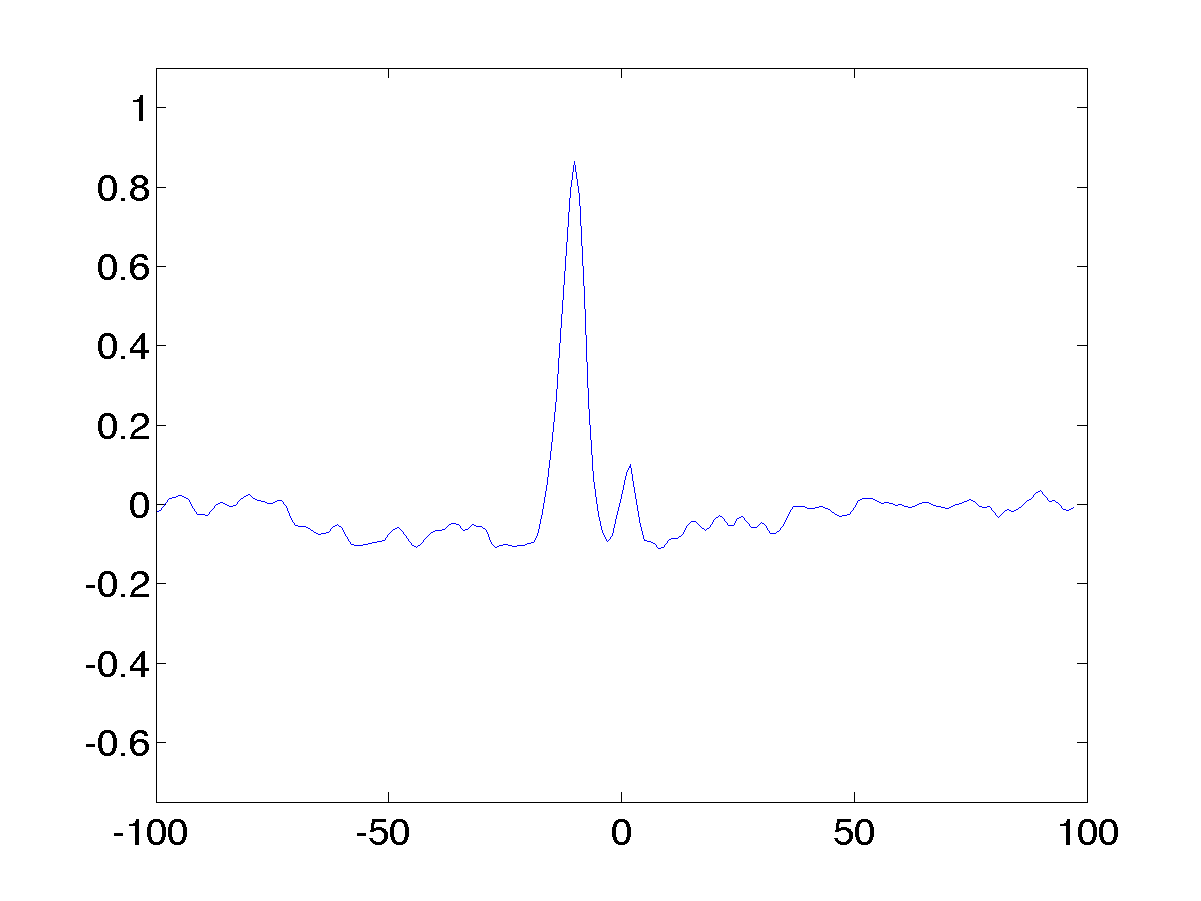
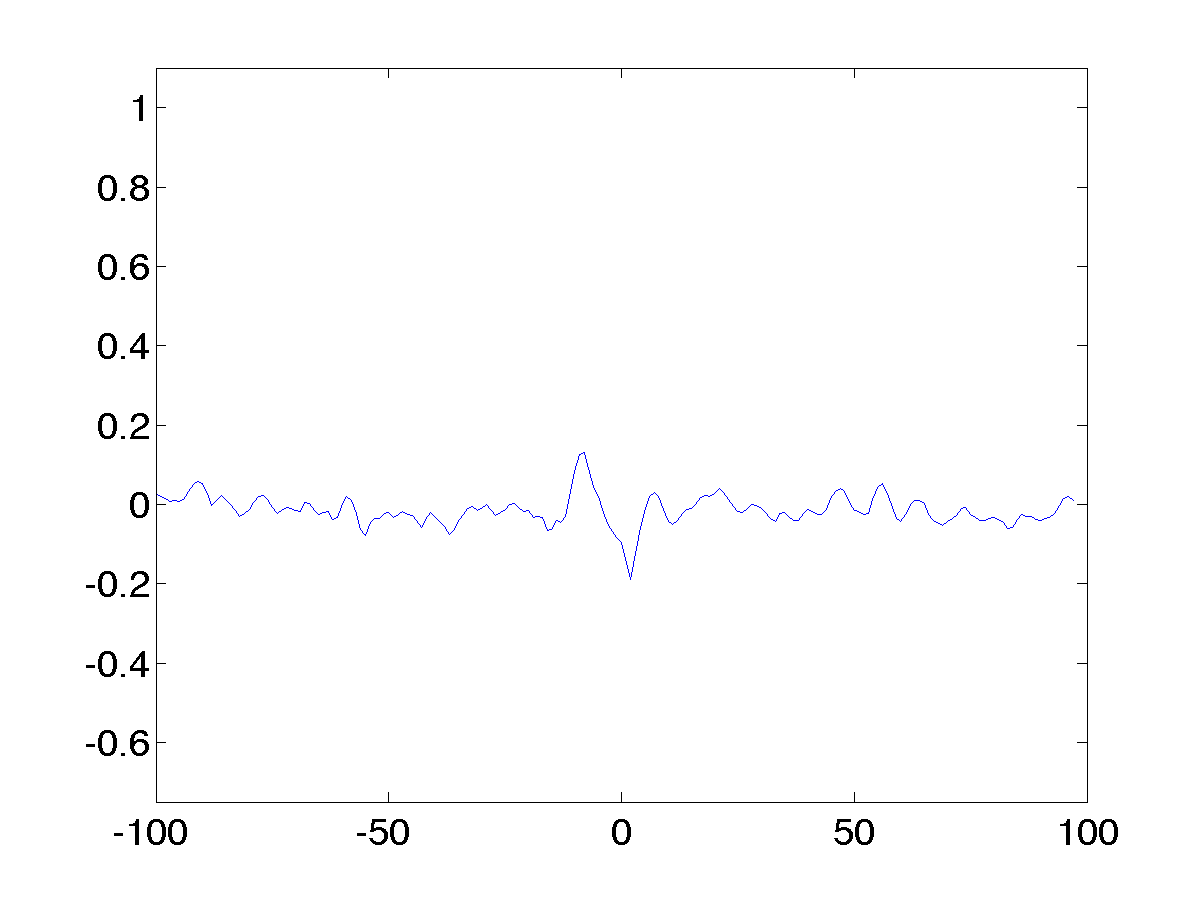
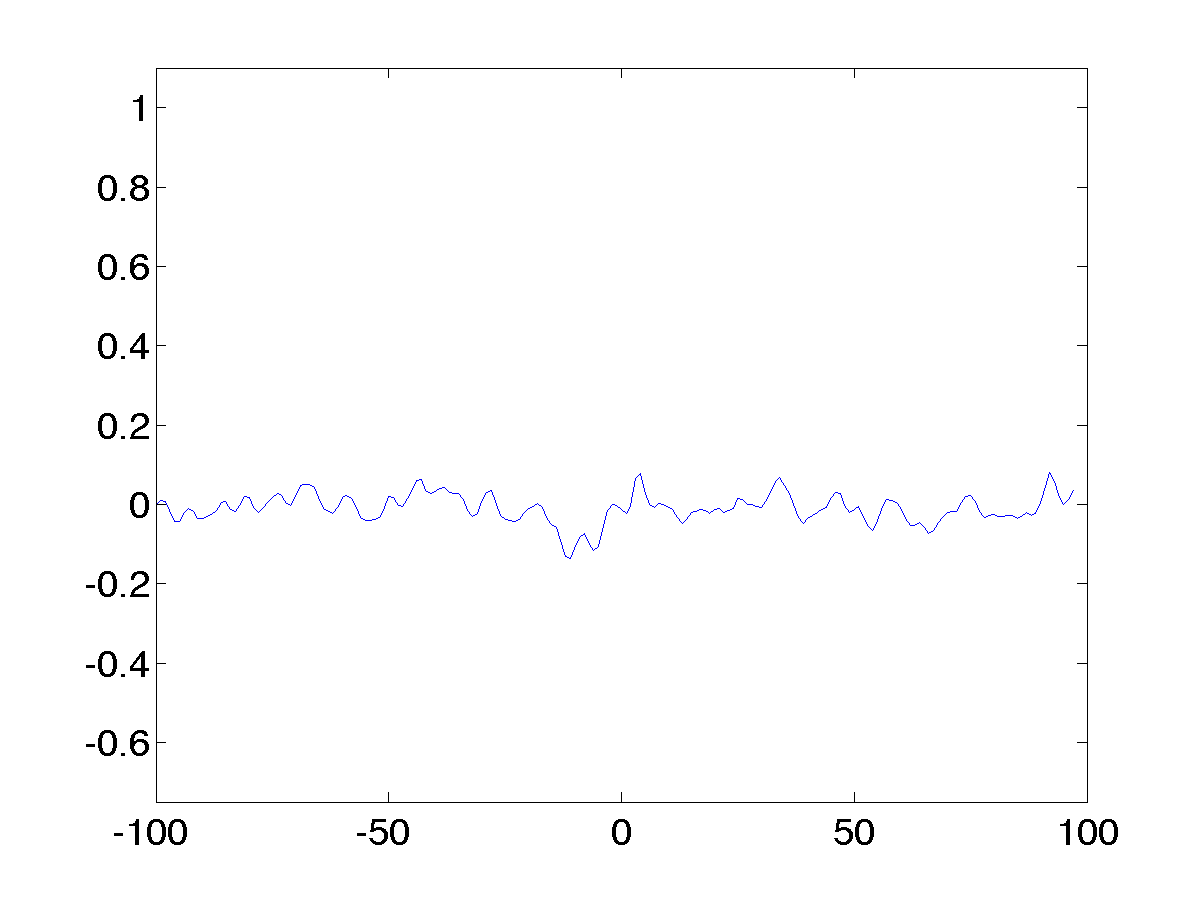
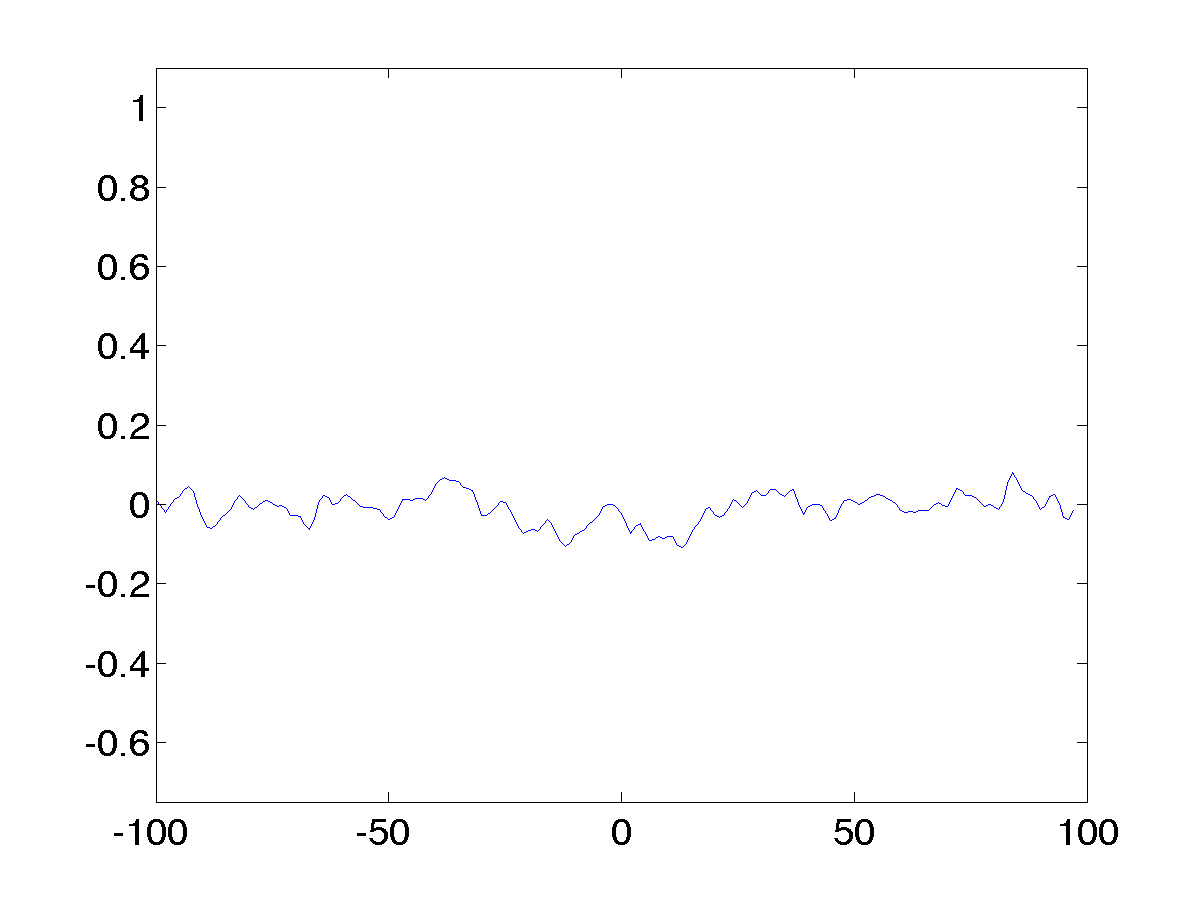
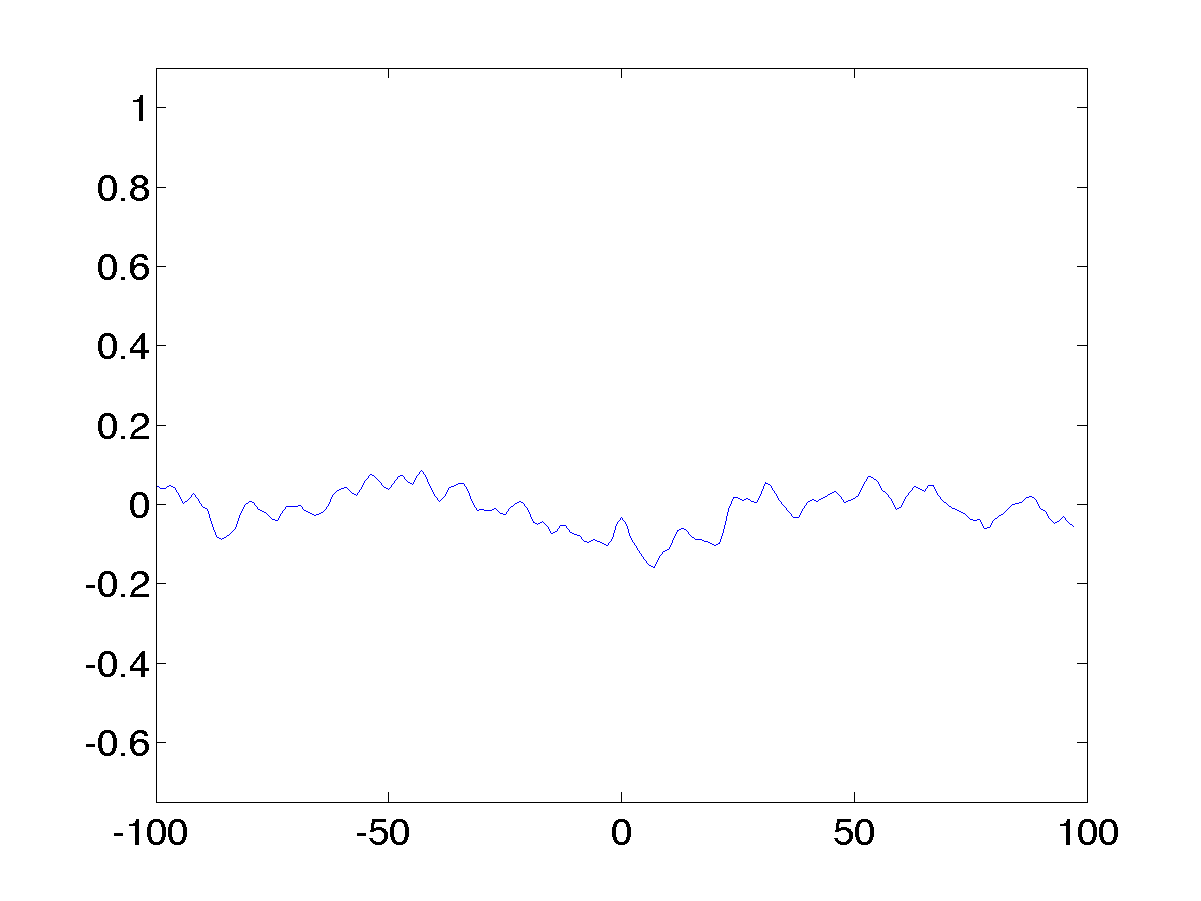
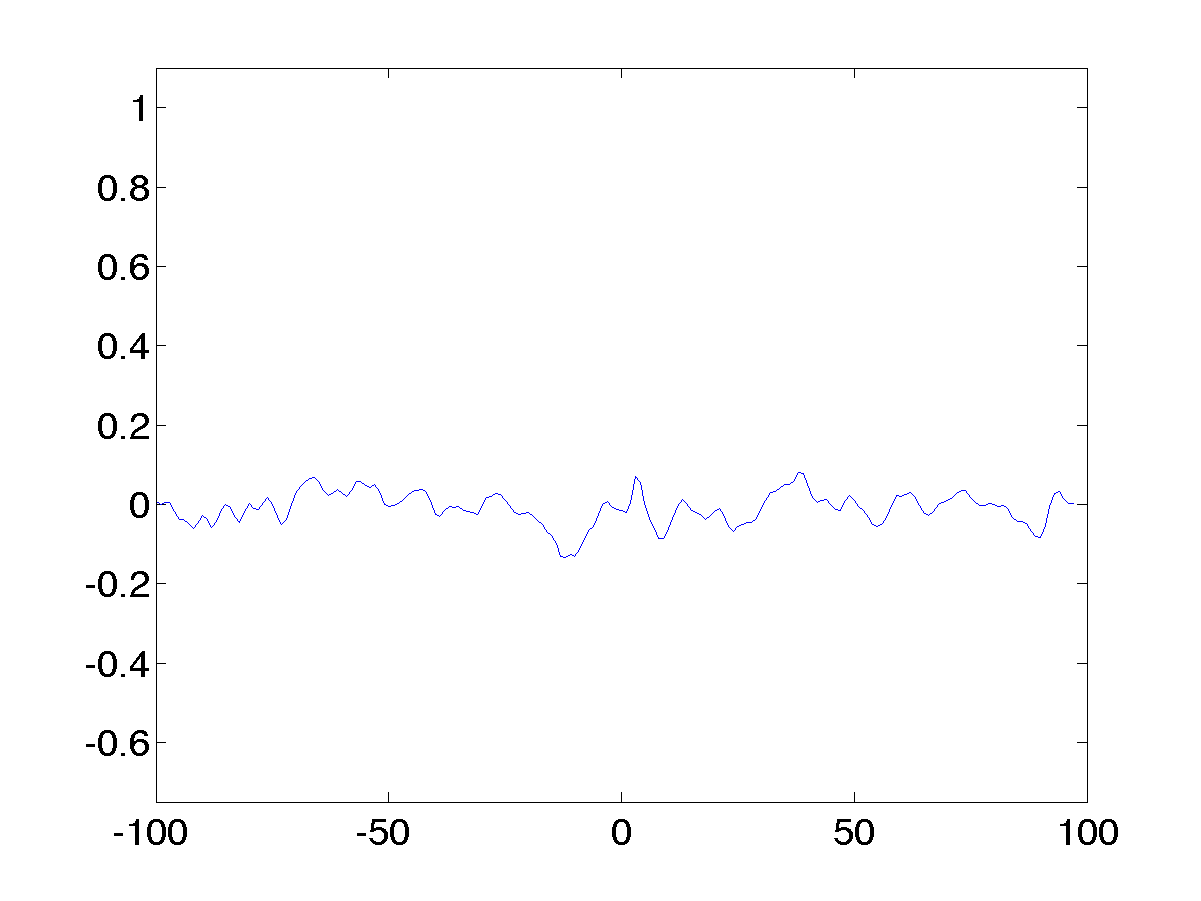
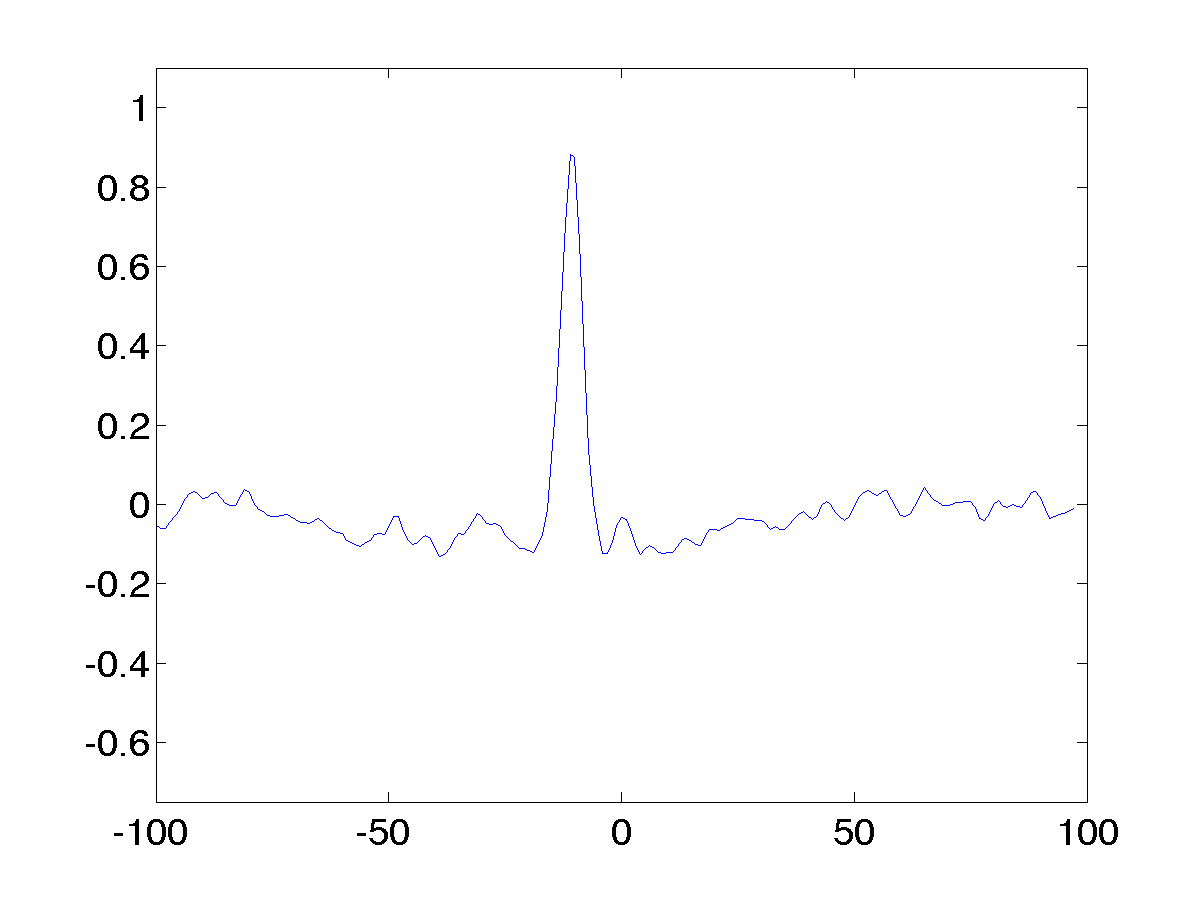
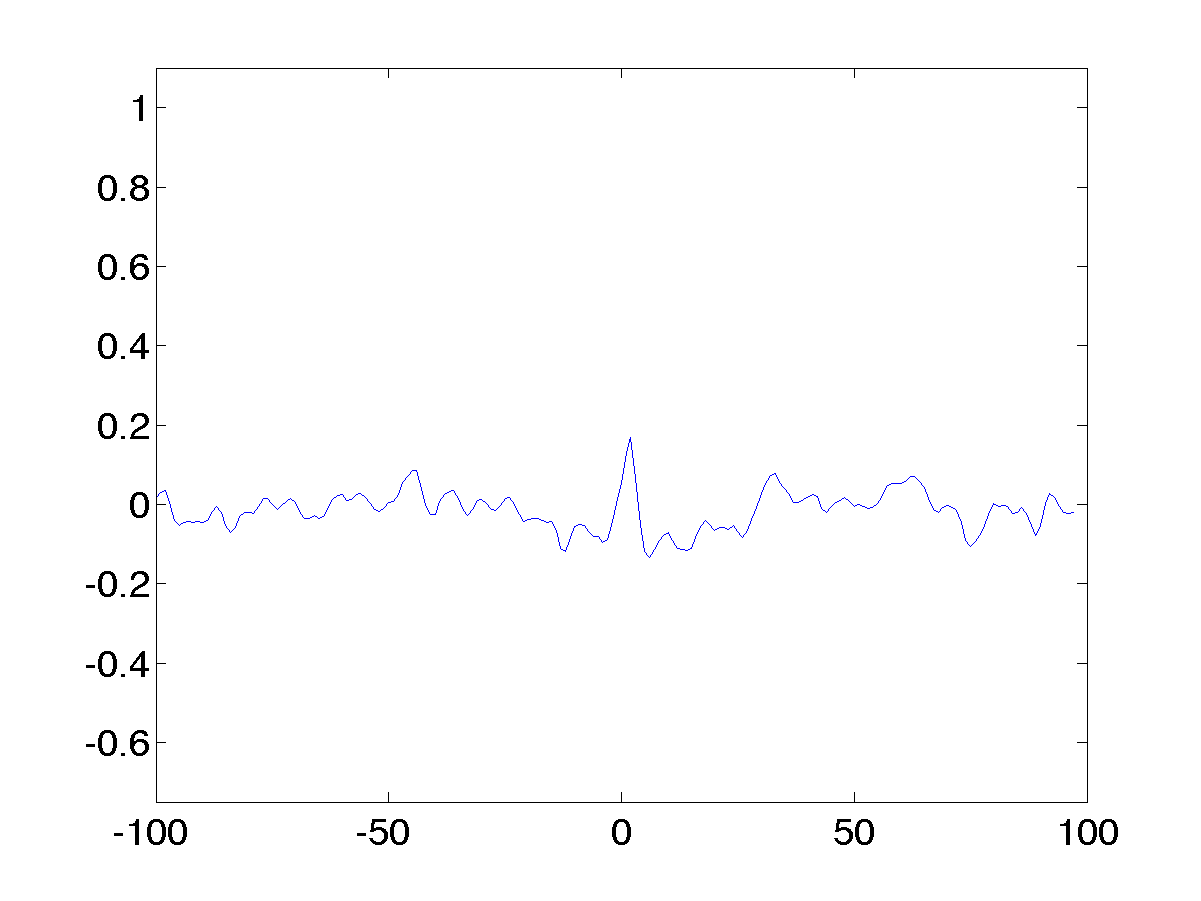
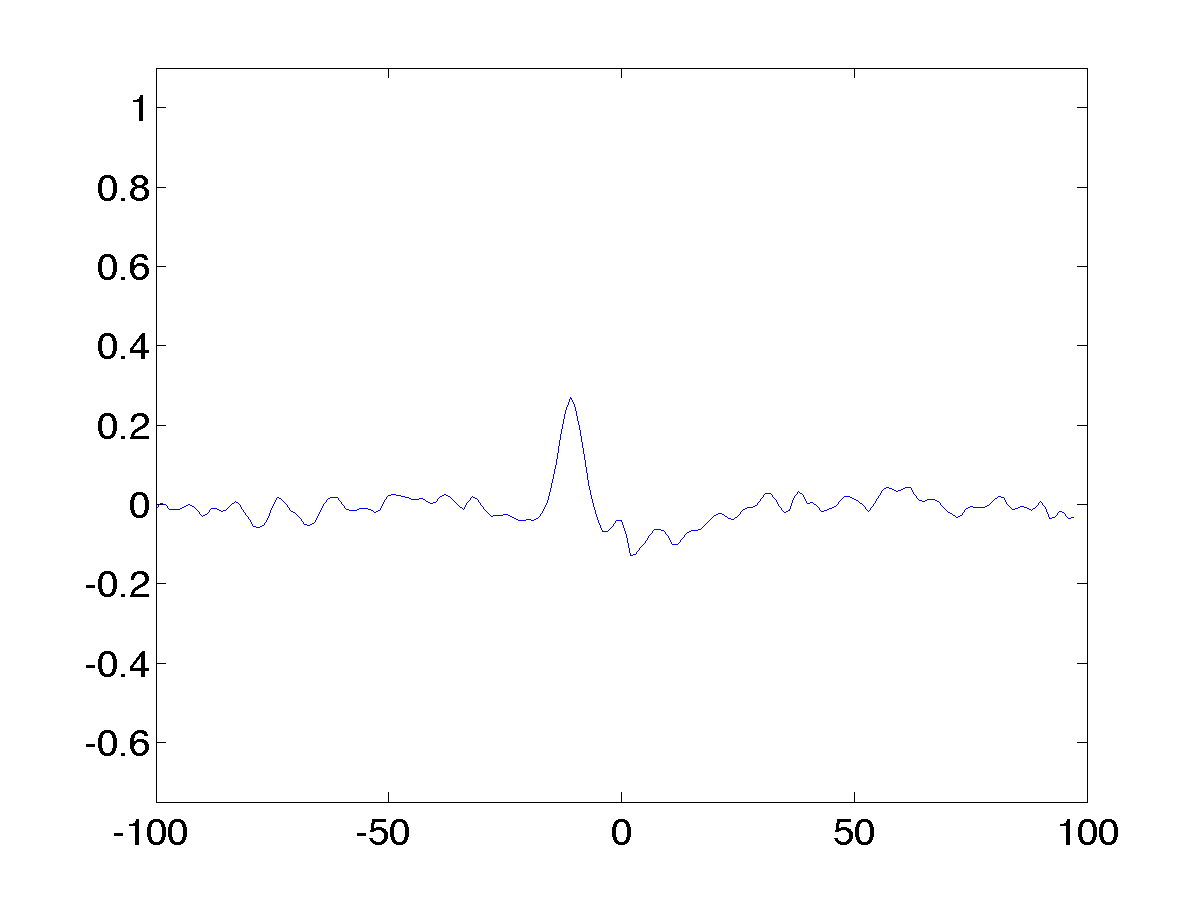
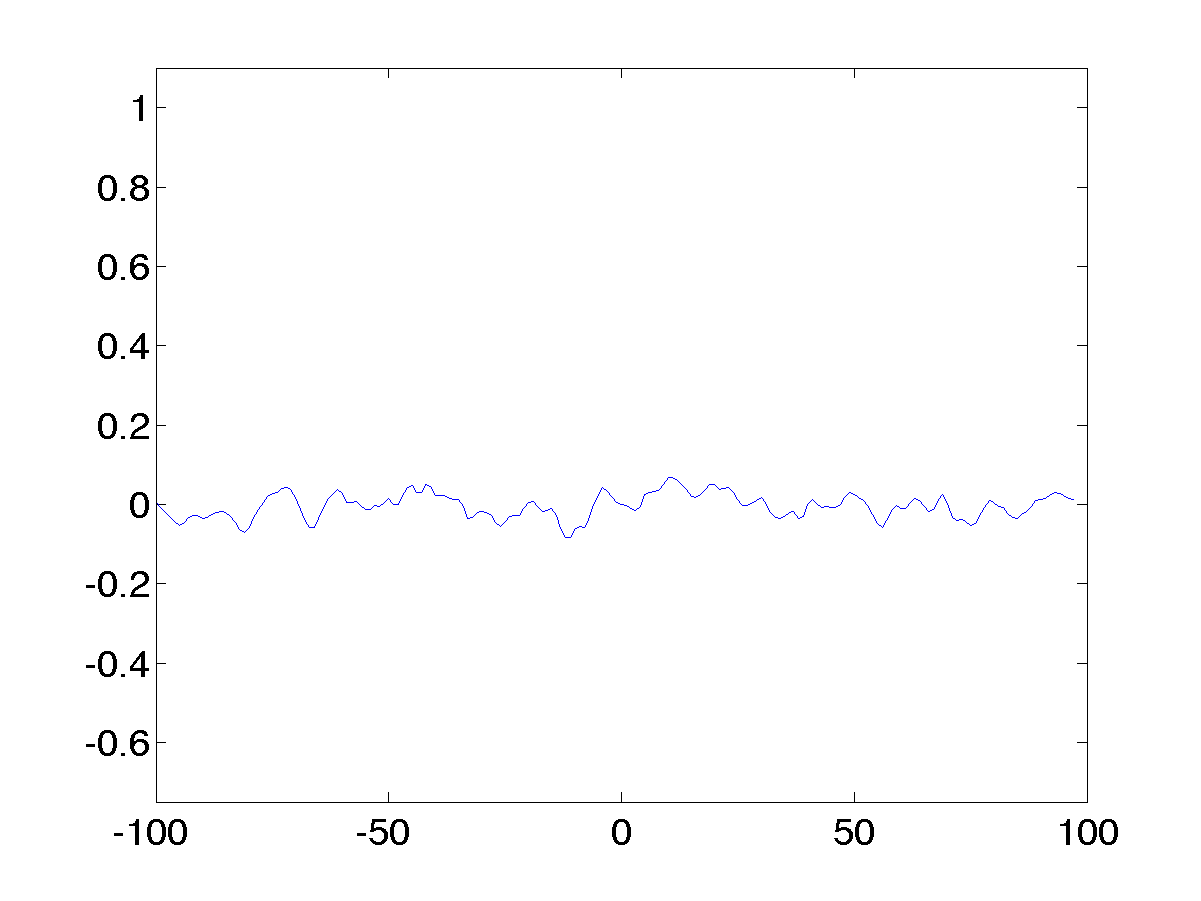
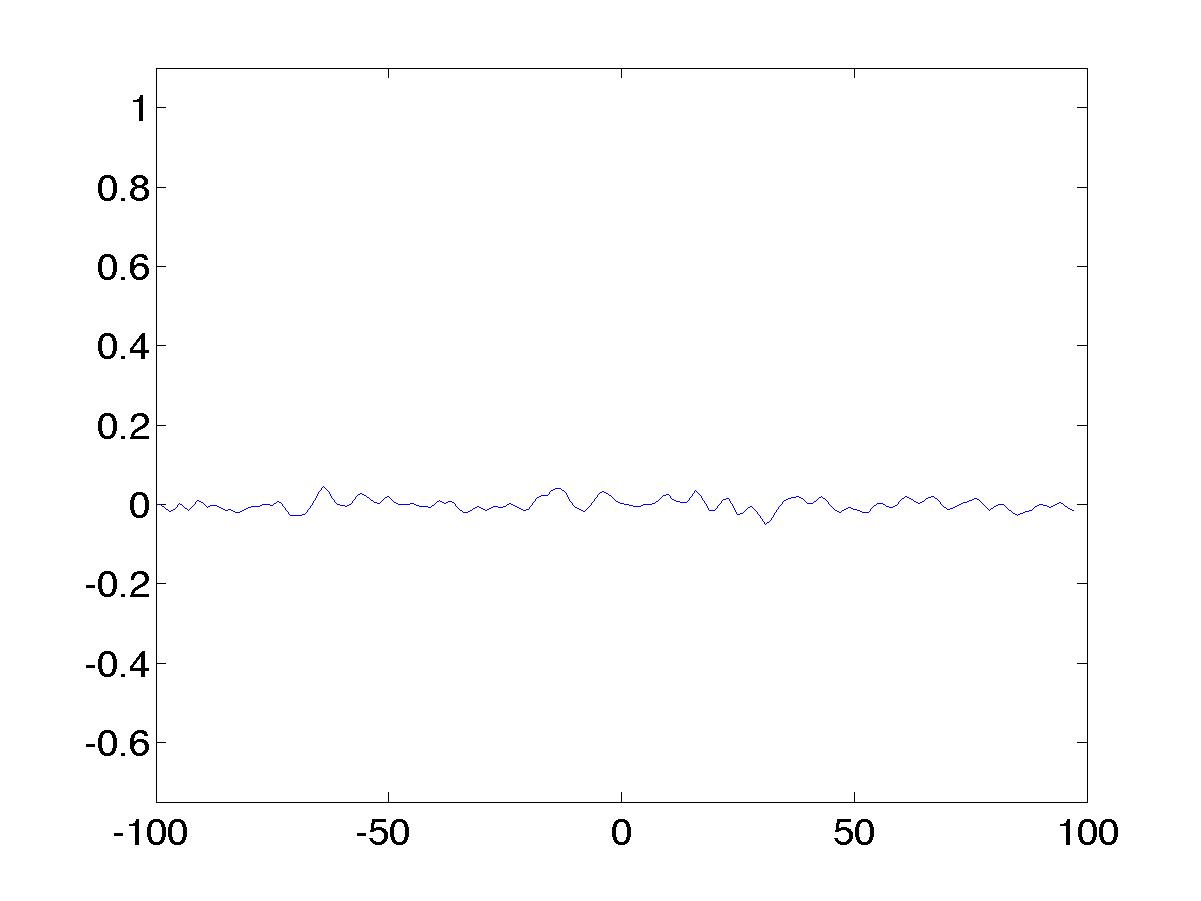
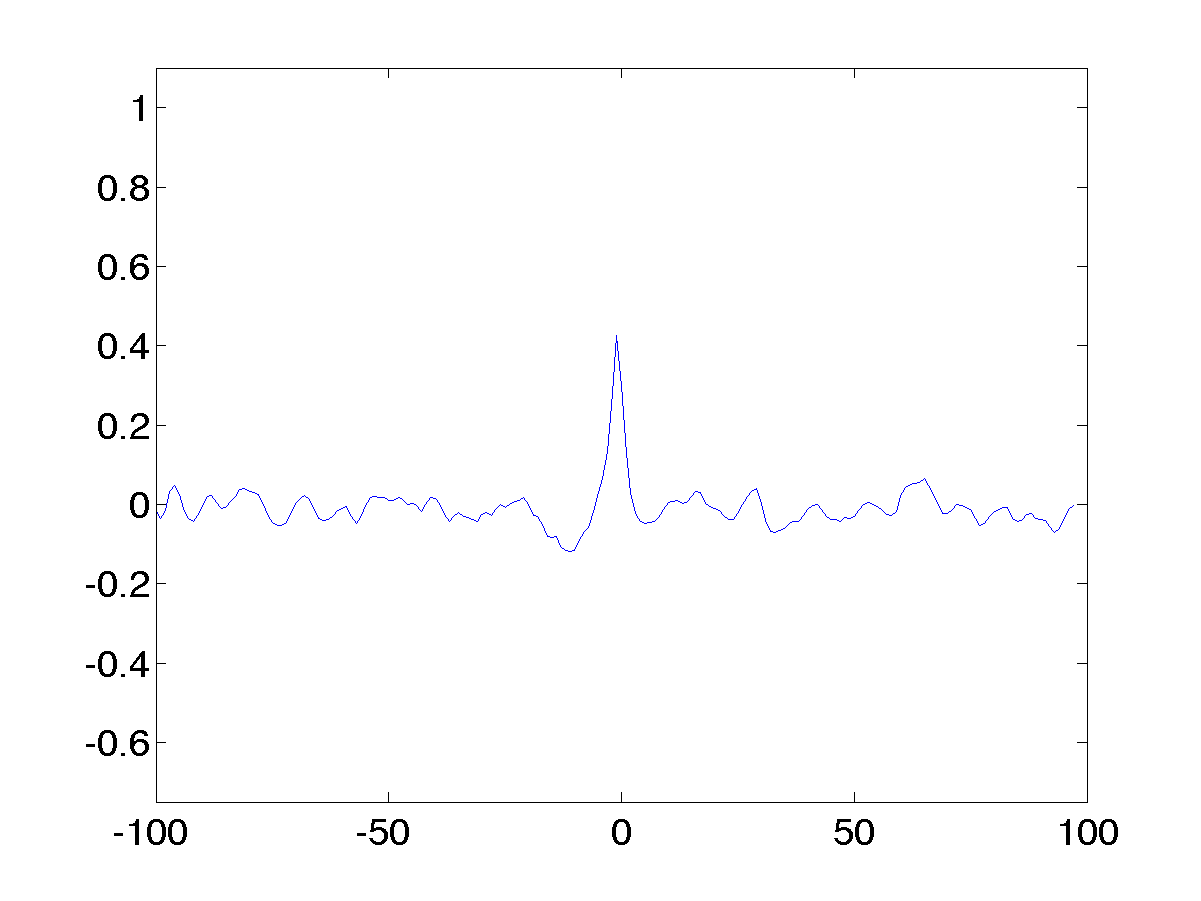
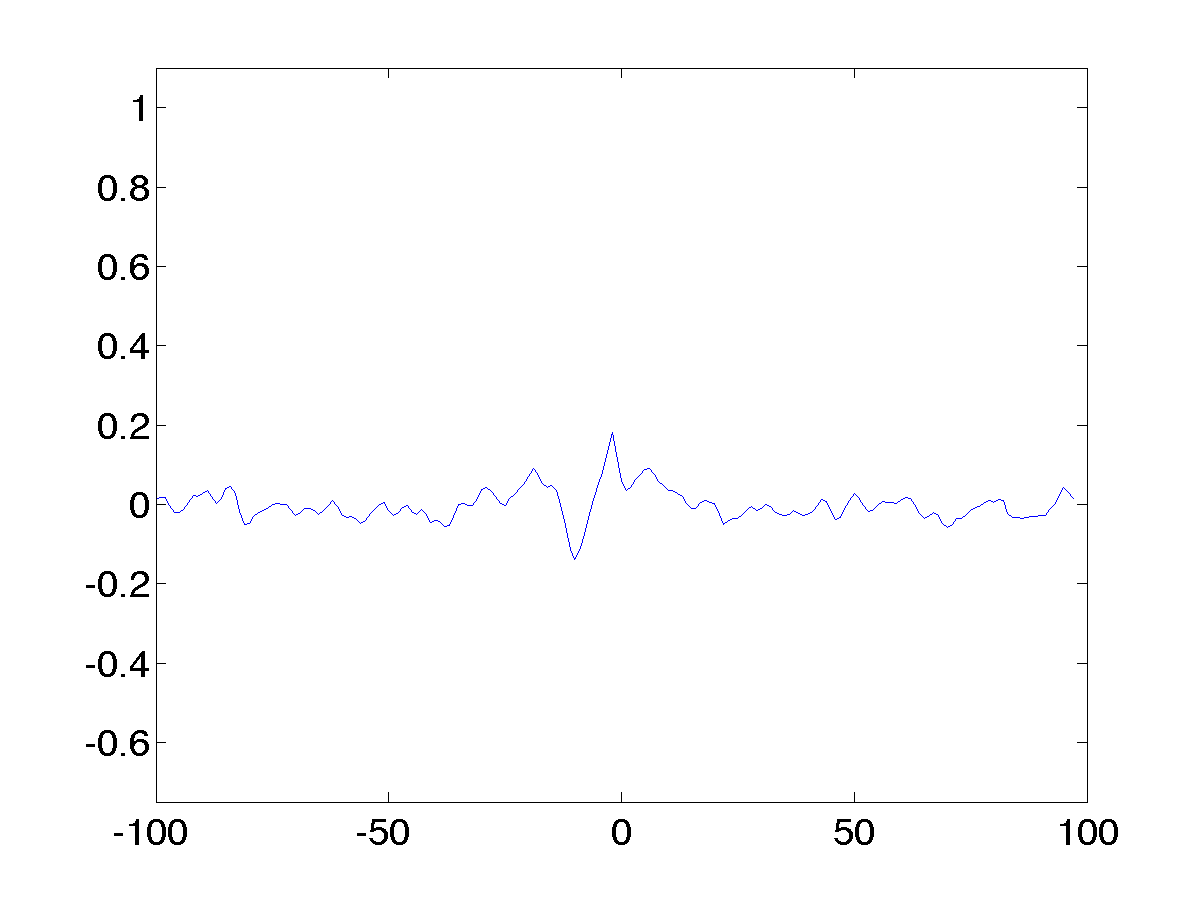
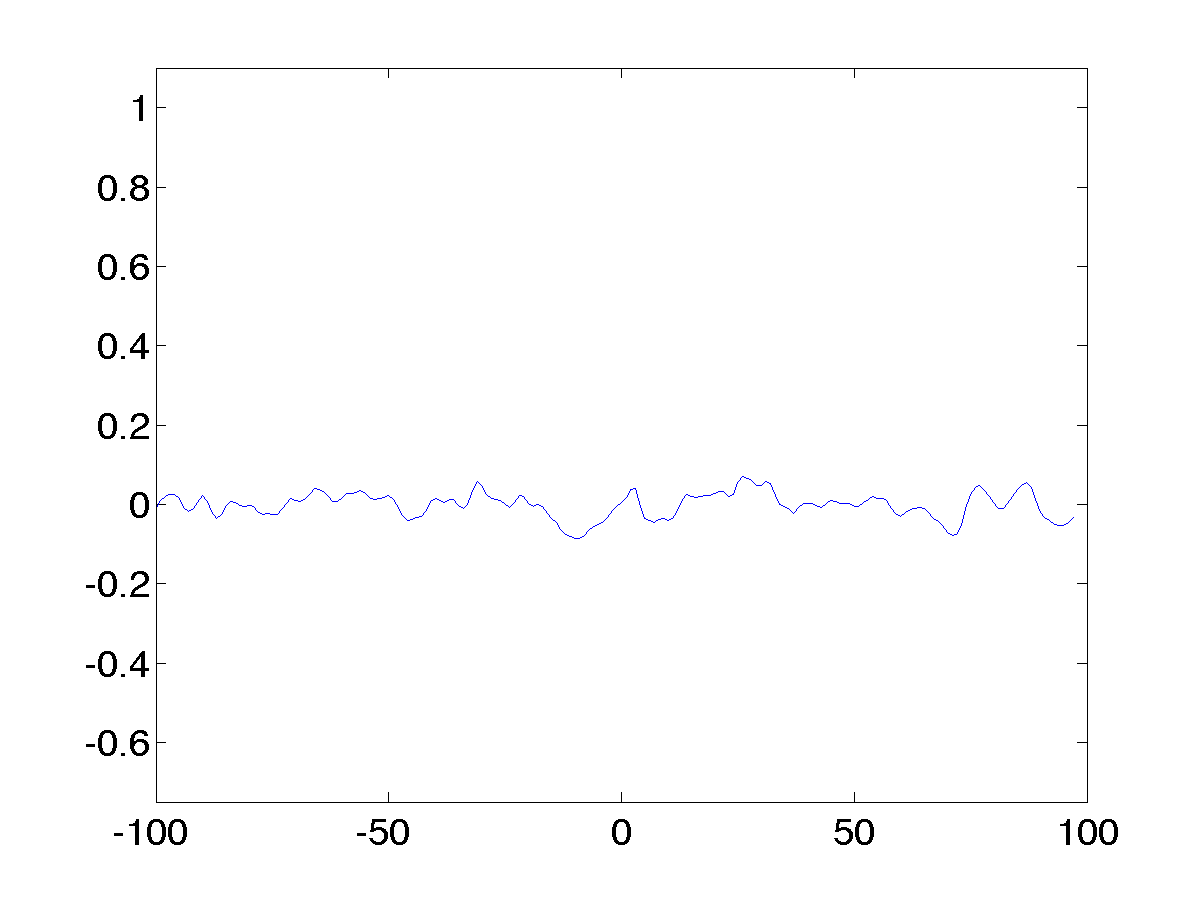
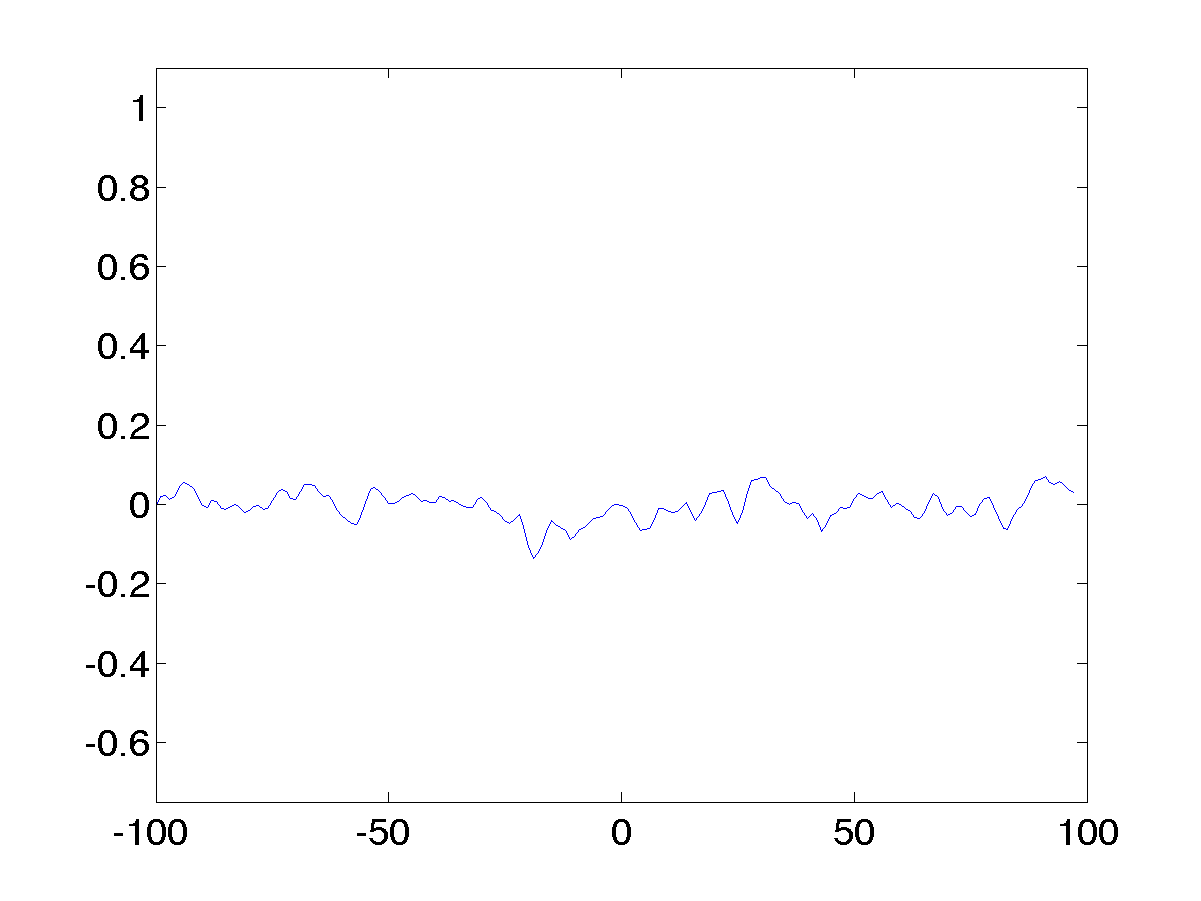
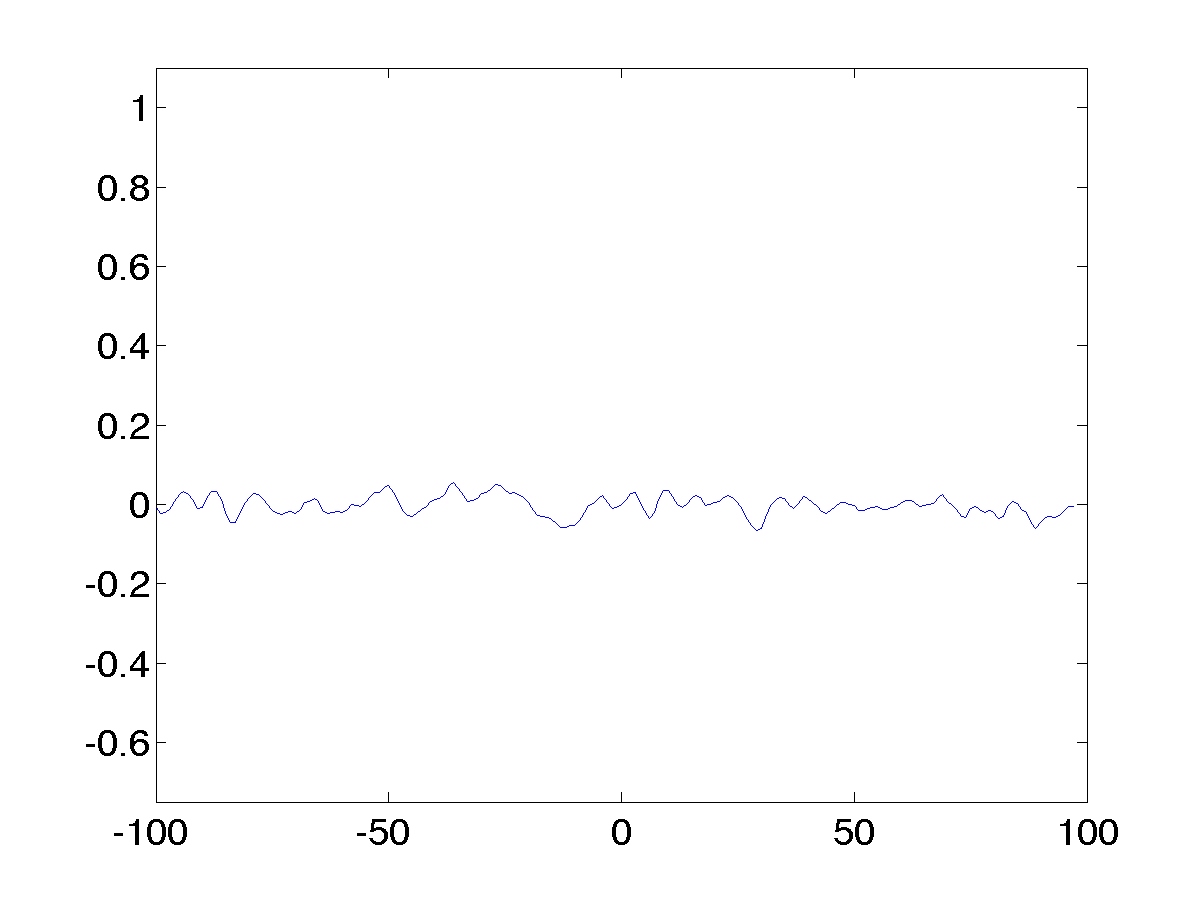
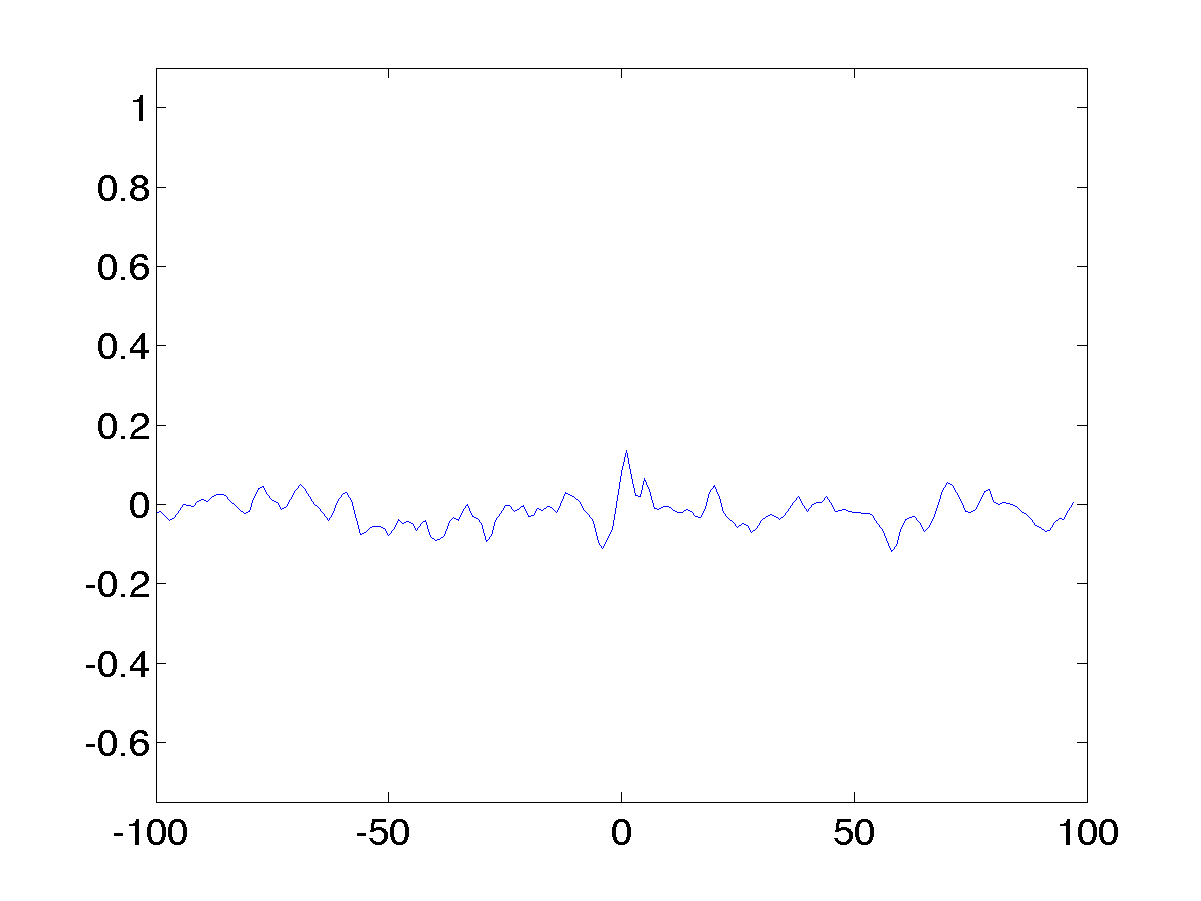
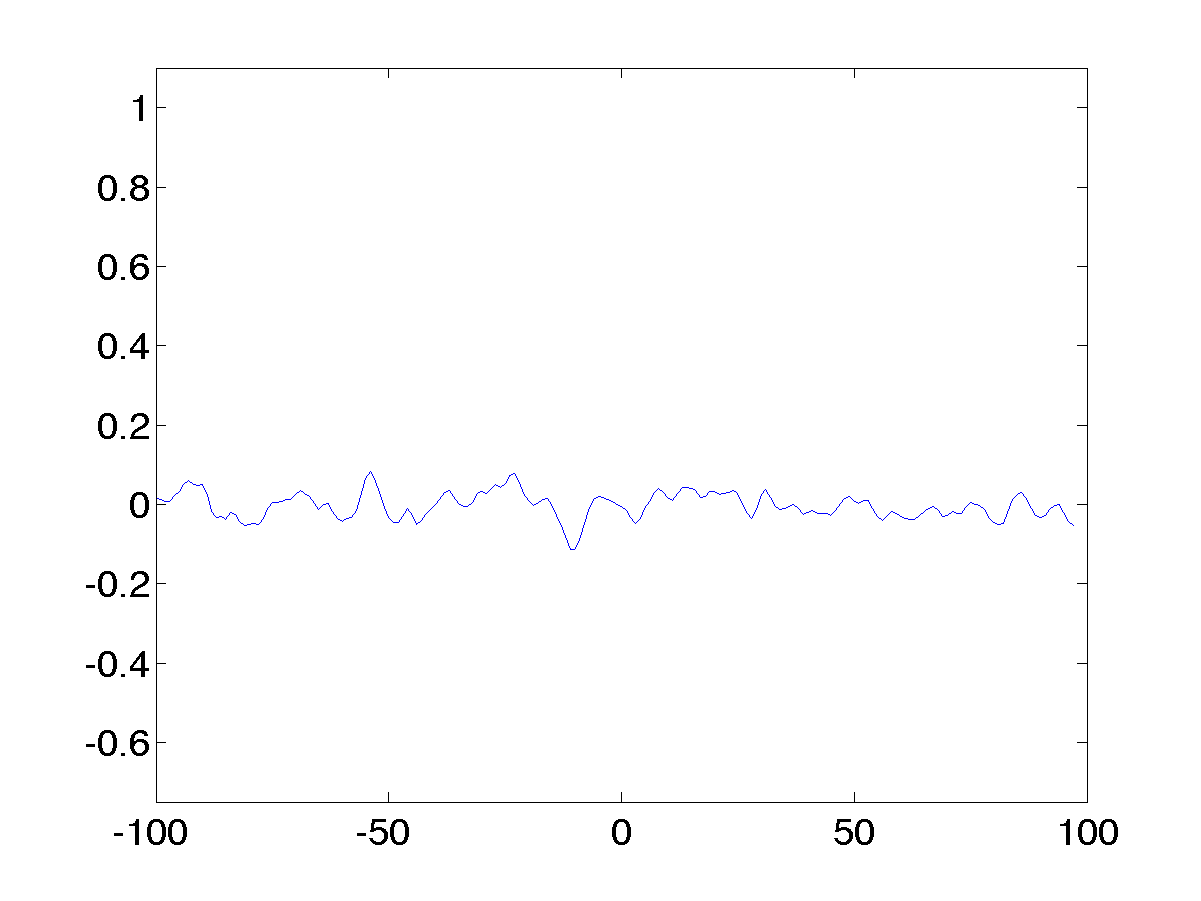
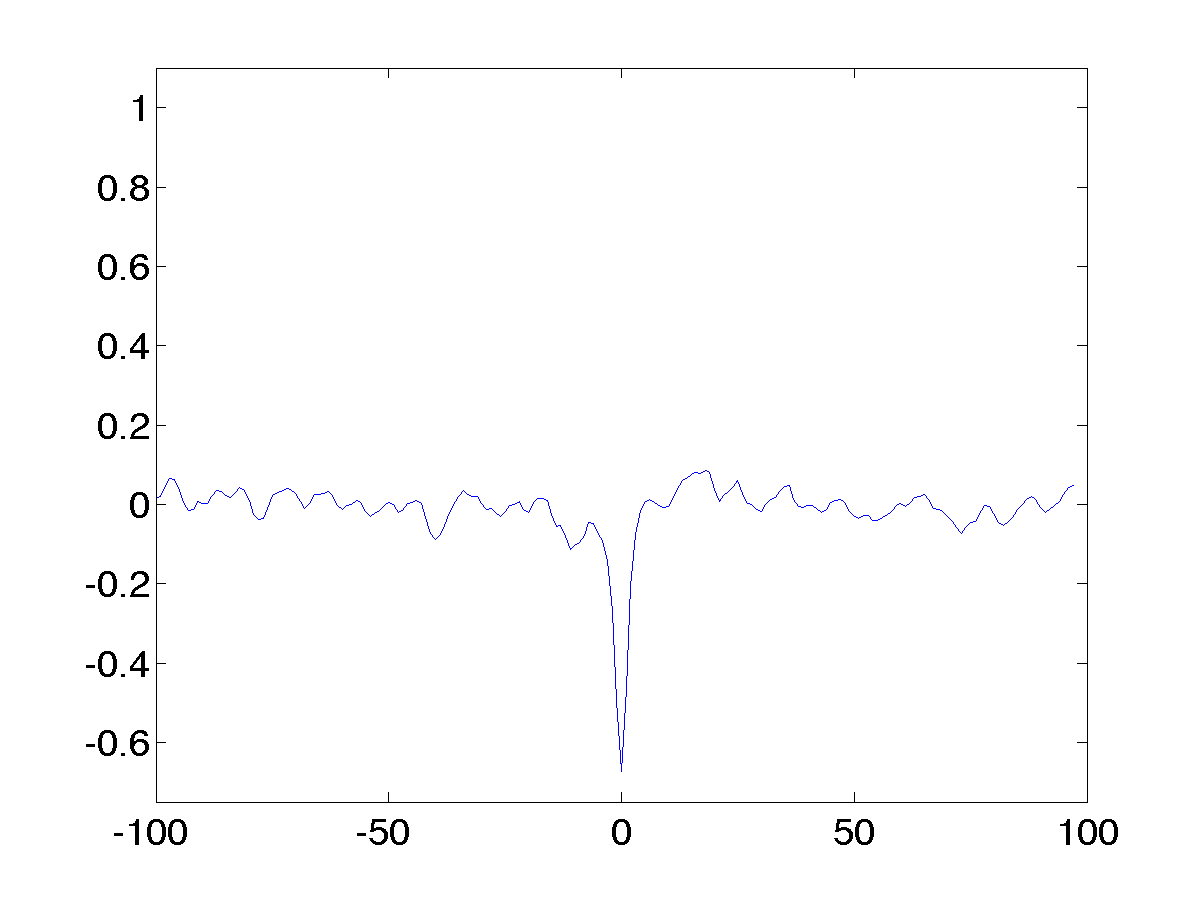
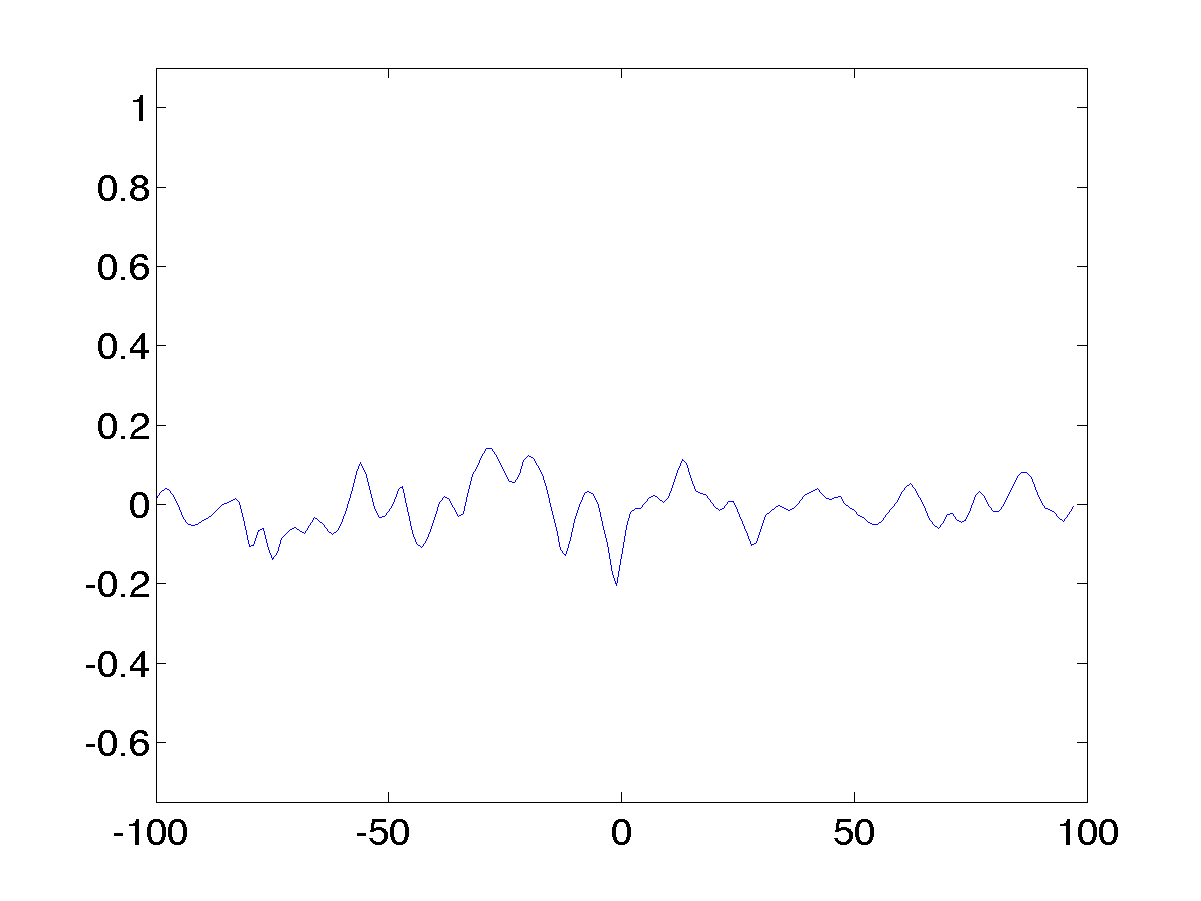
Plots of the Trimer Functions
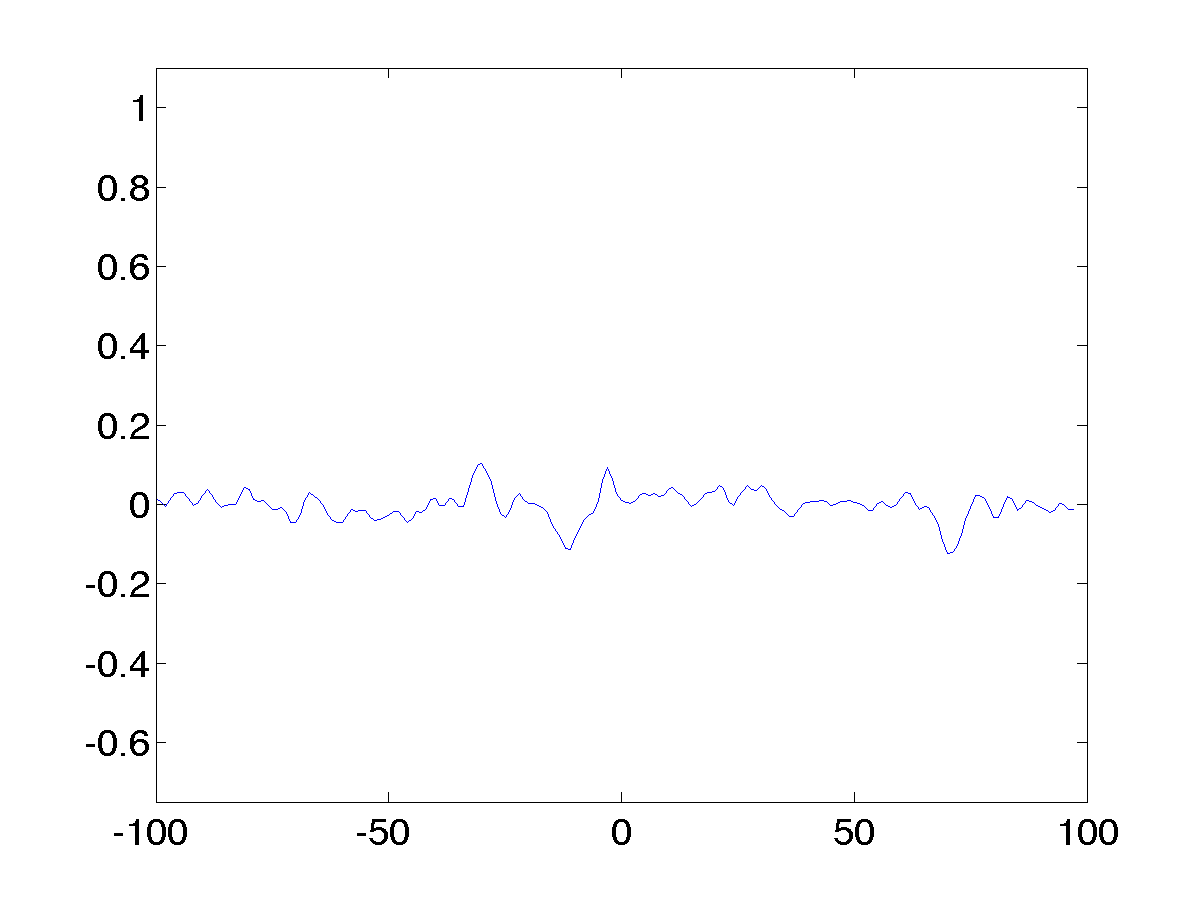
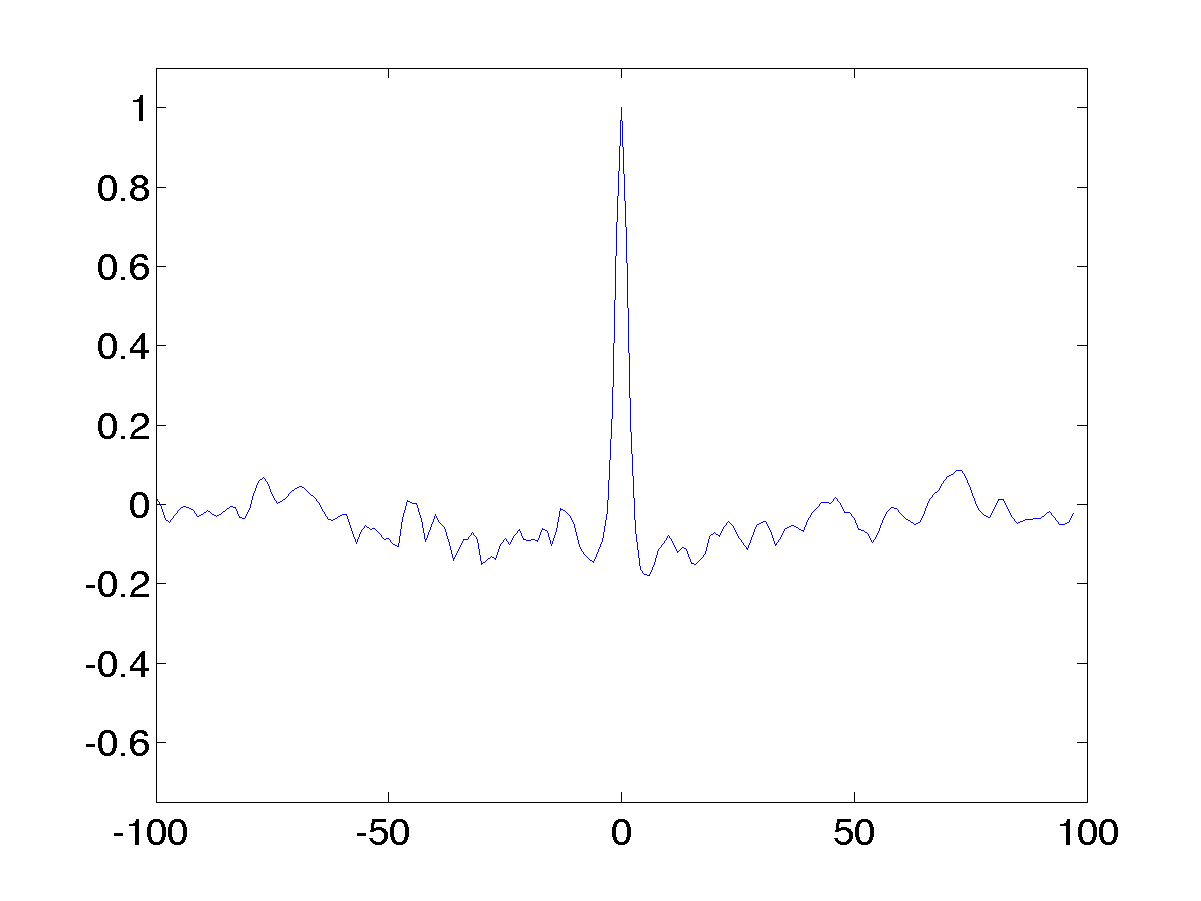
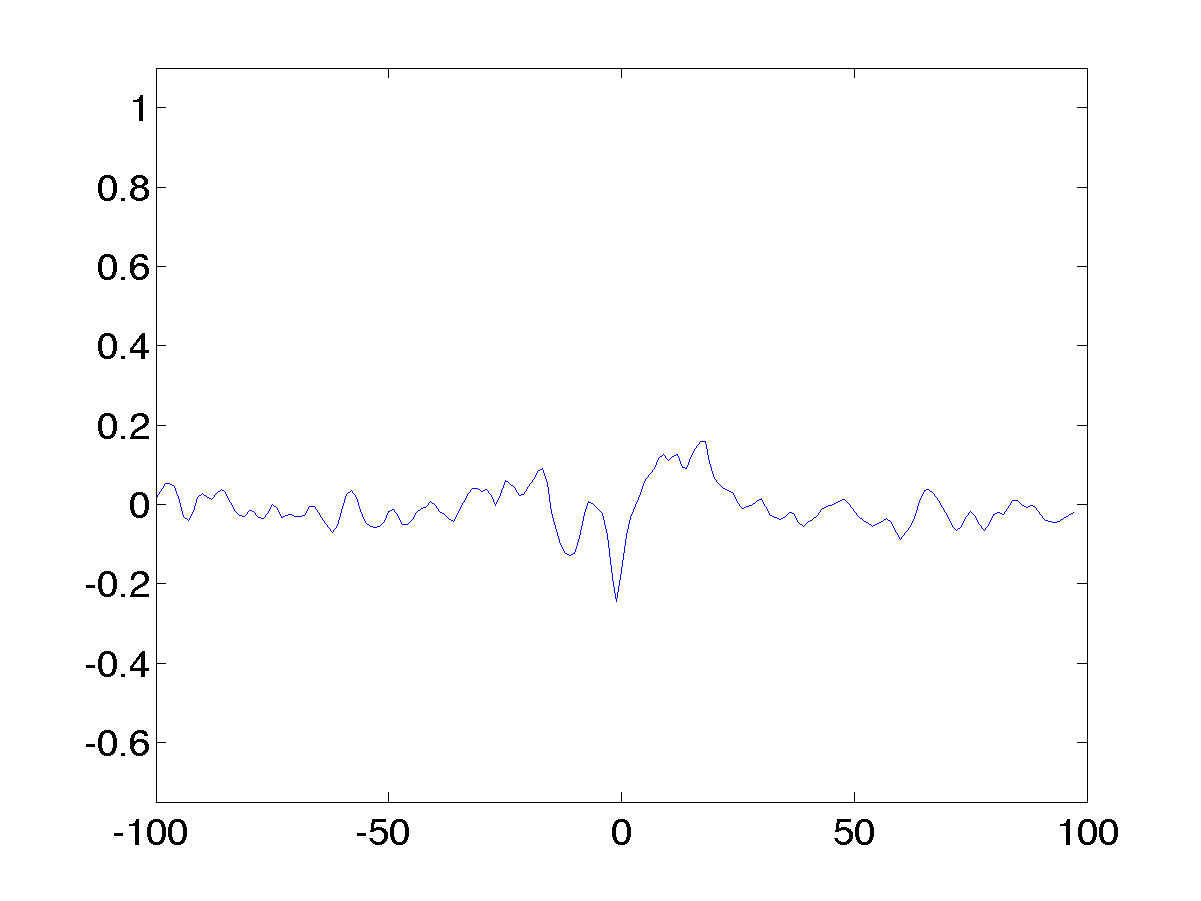
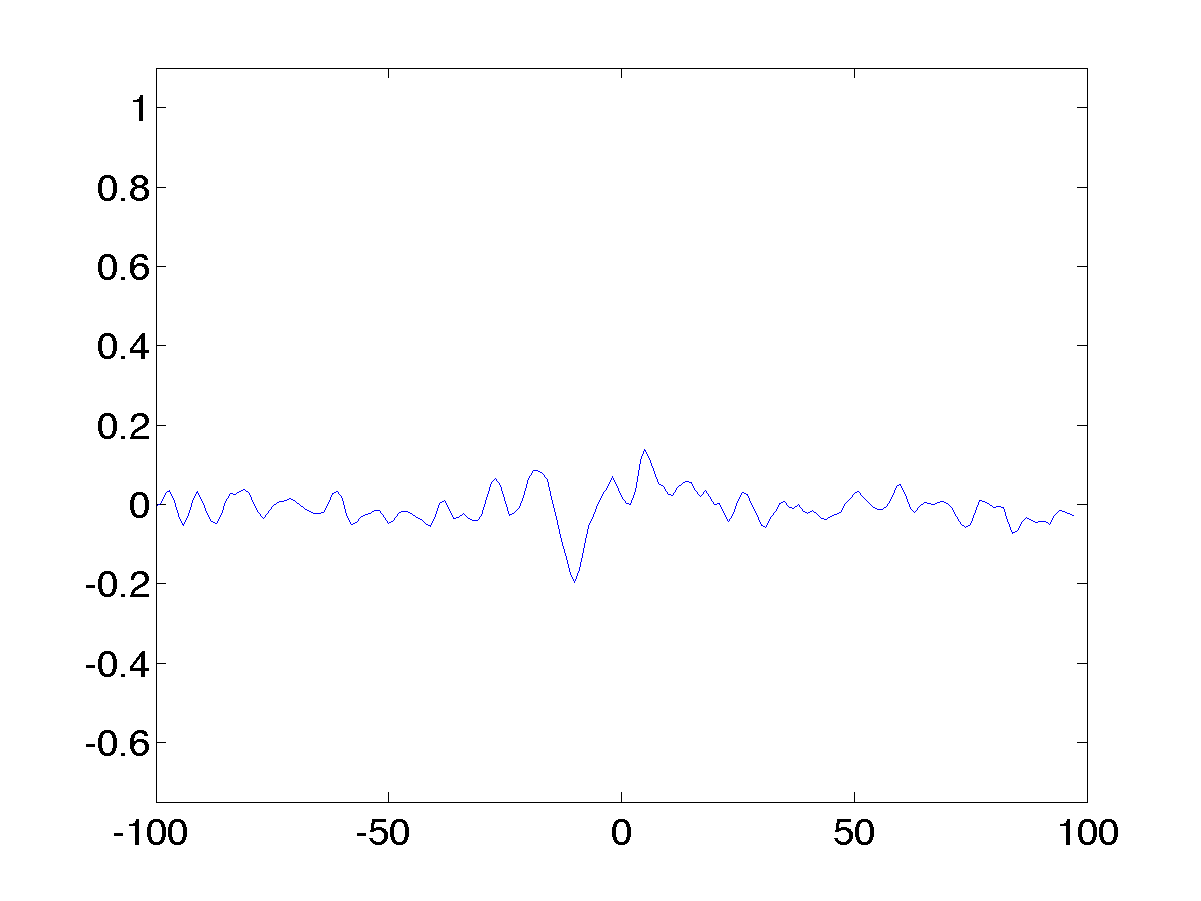
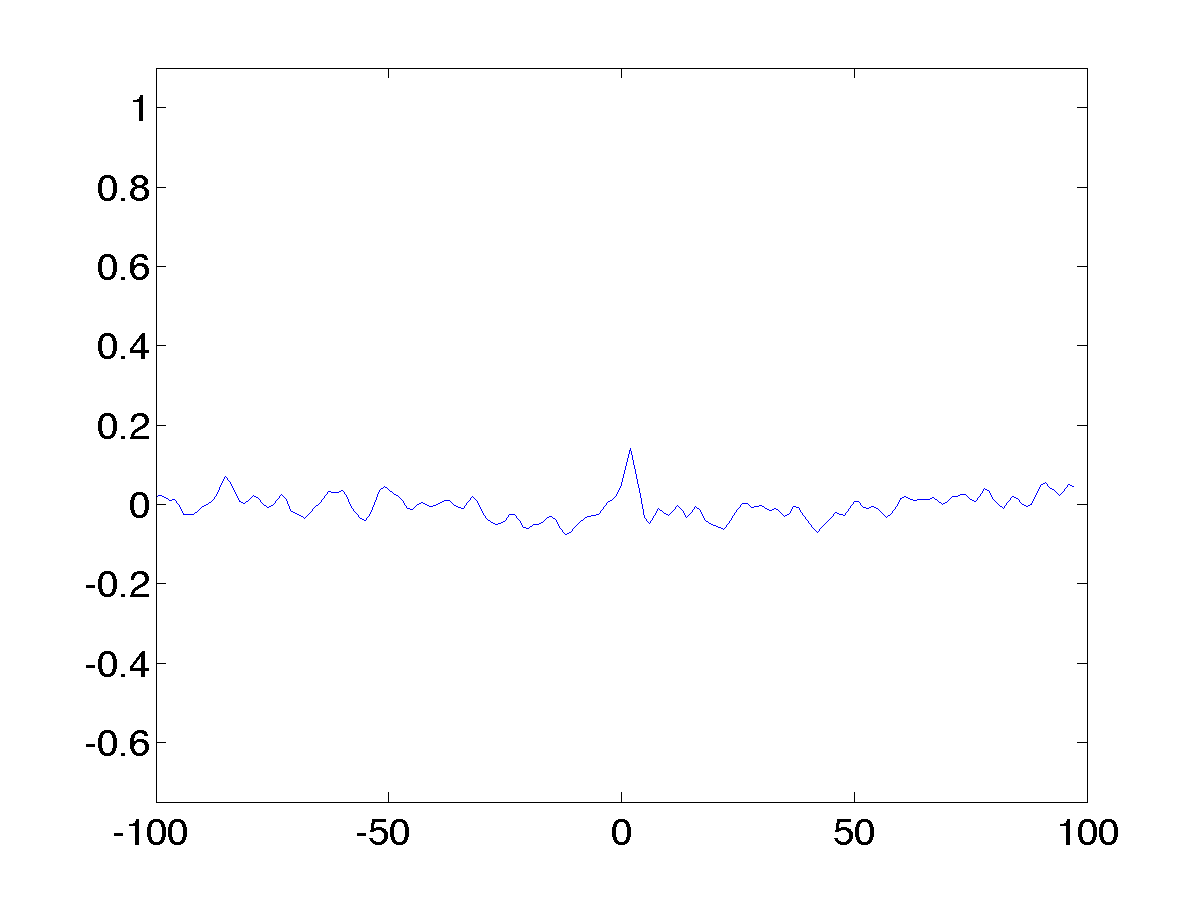
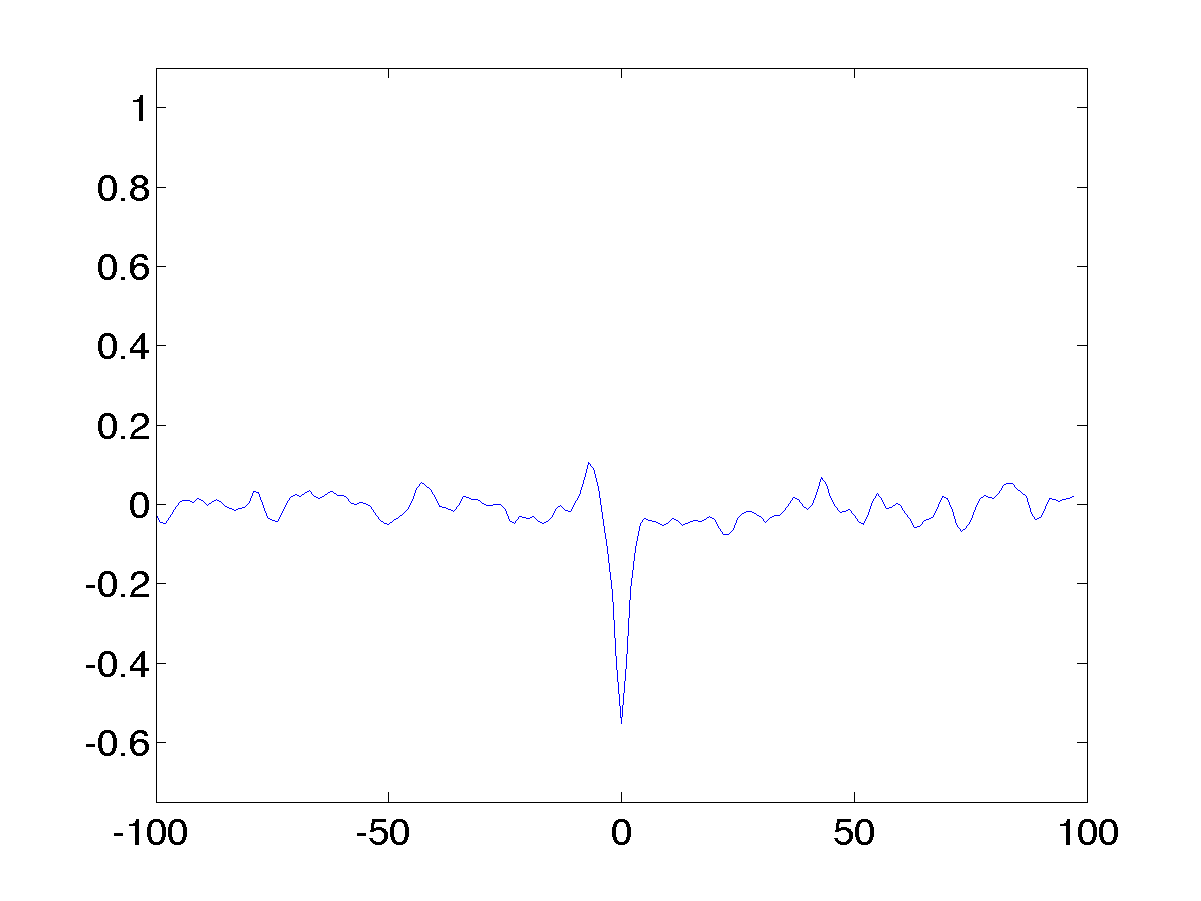
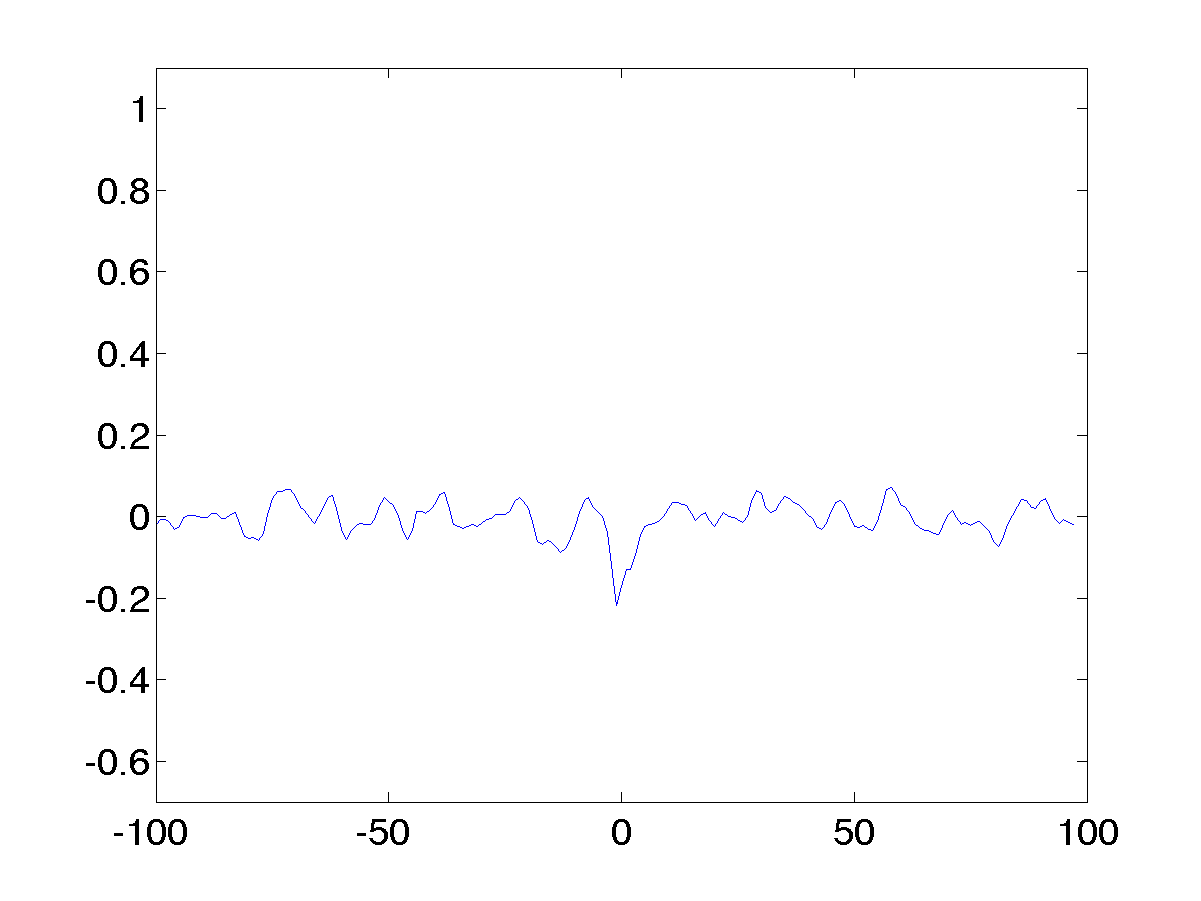
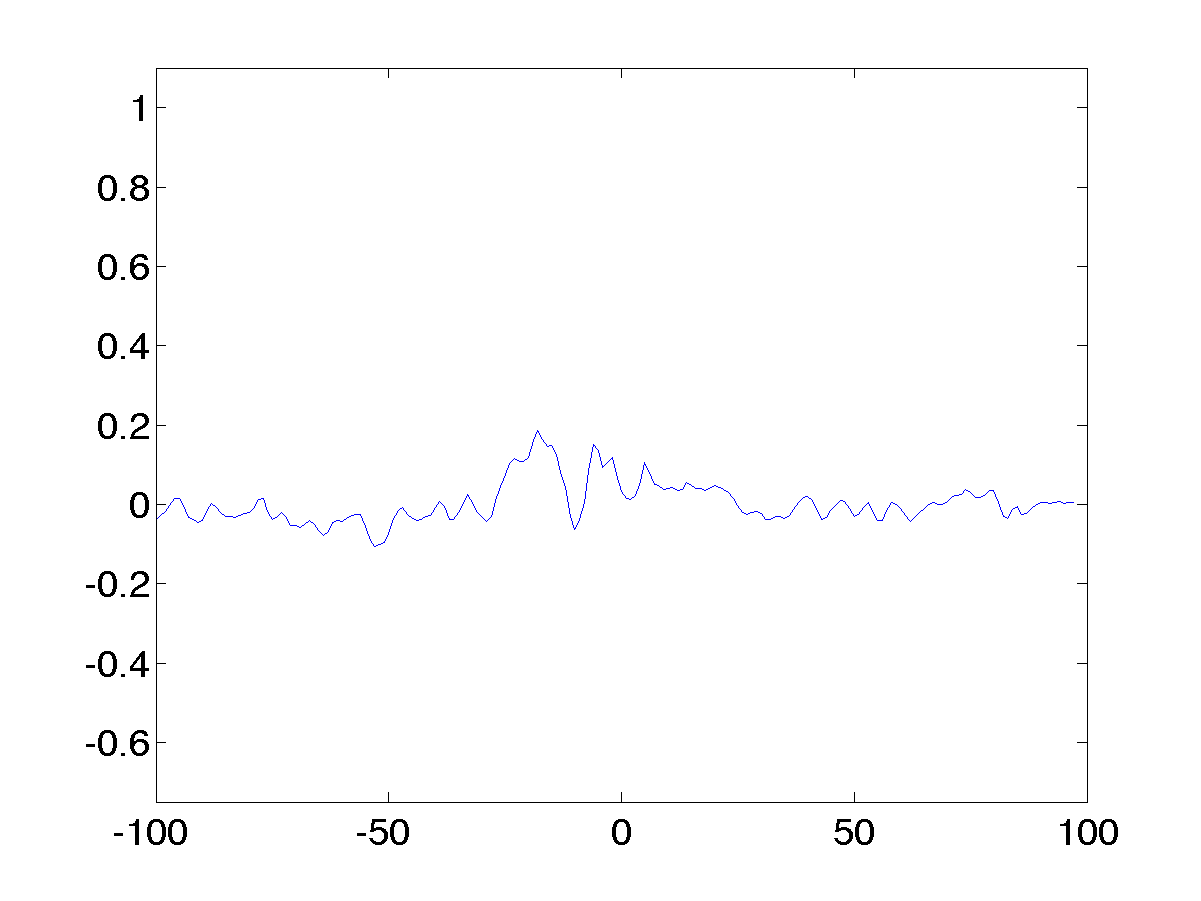
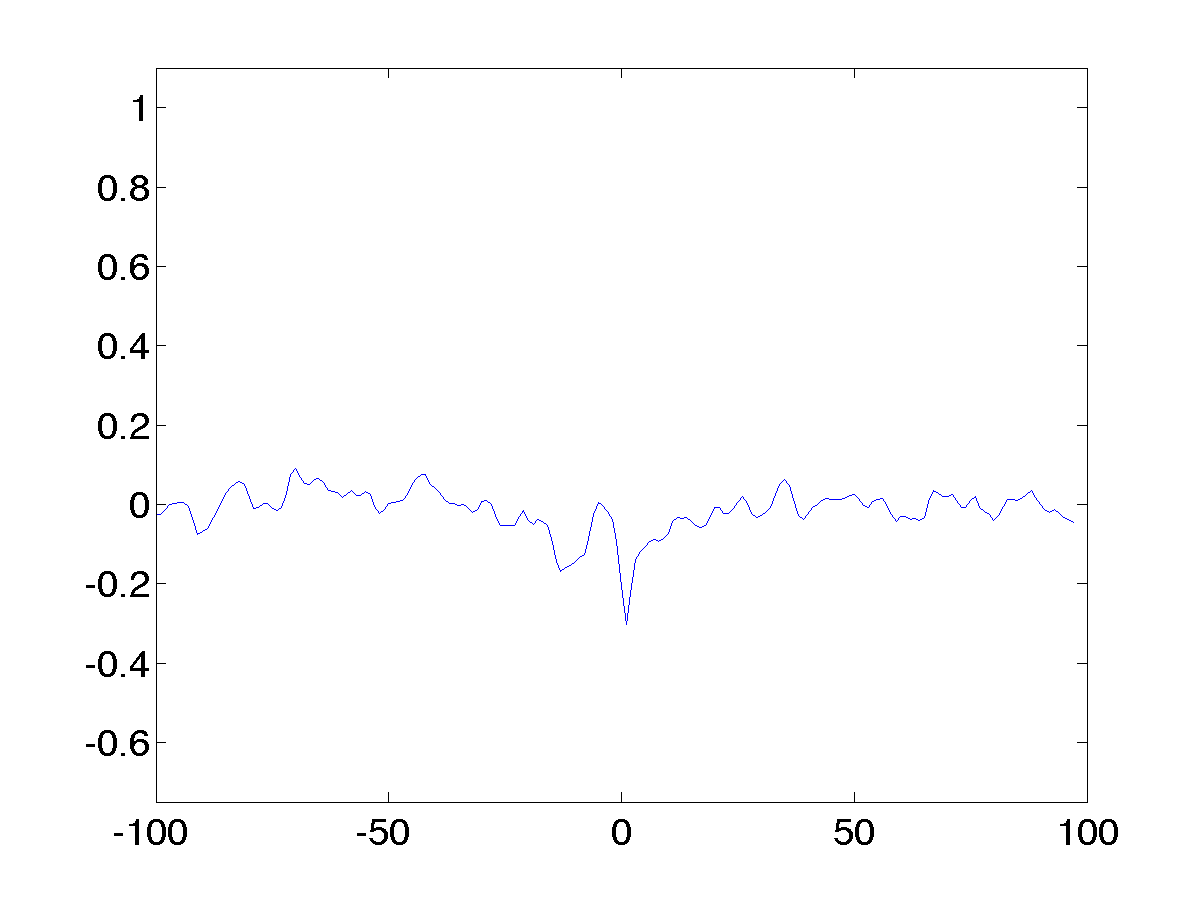
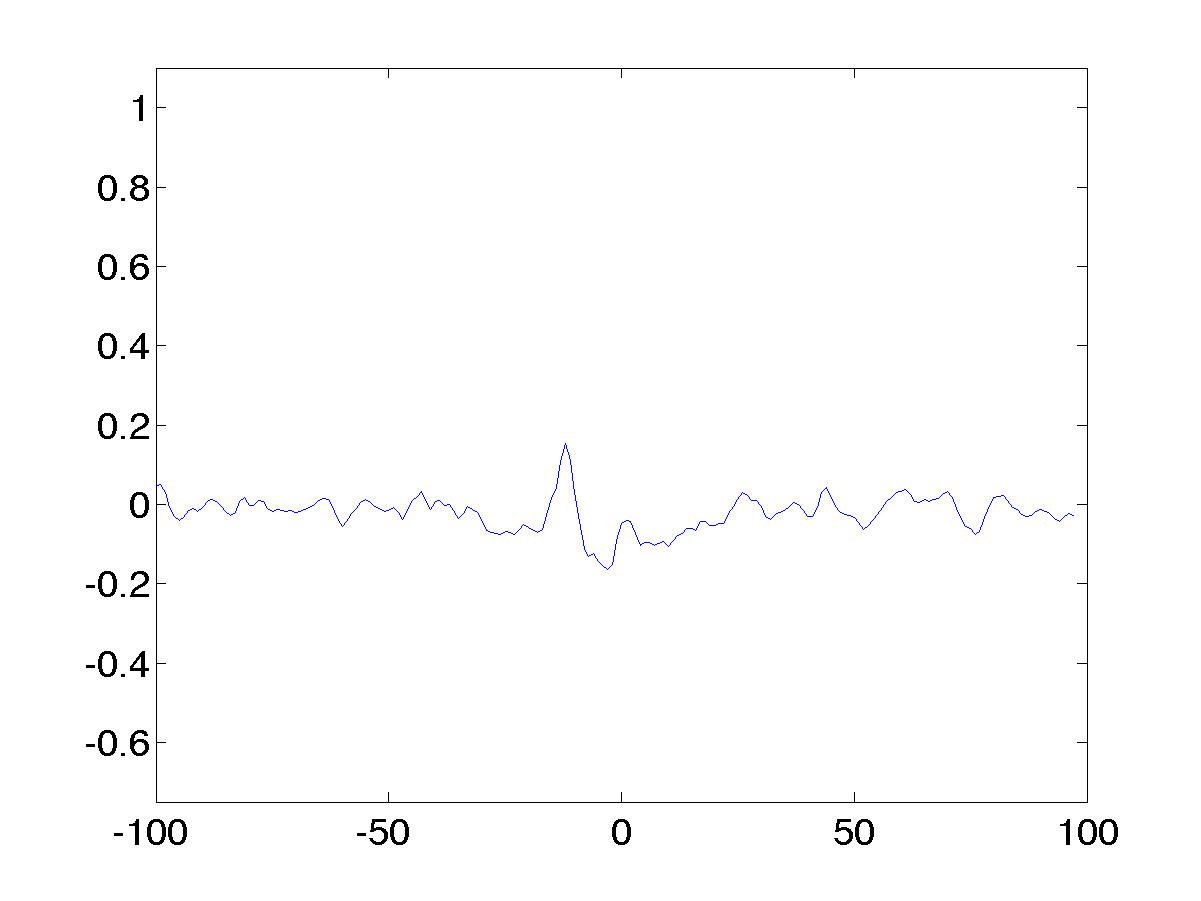
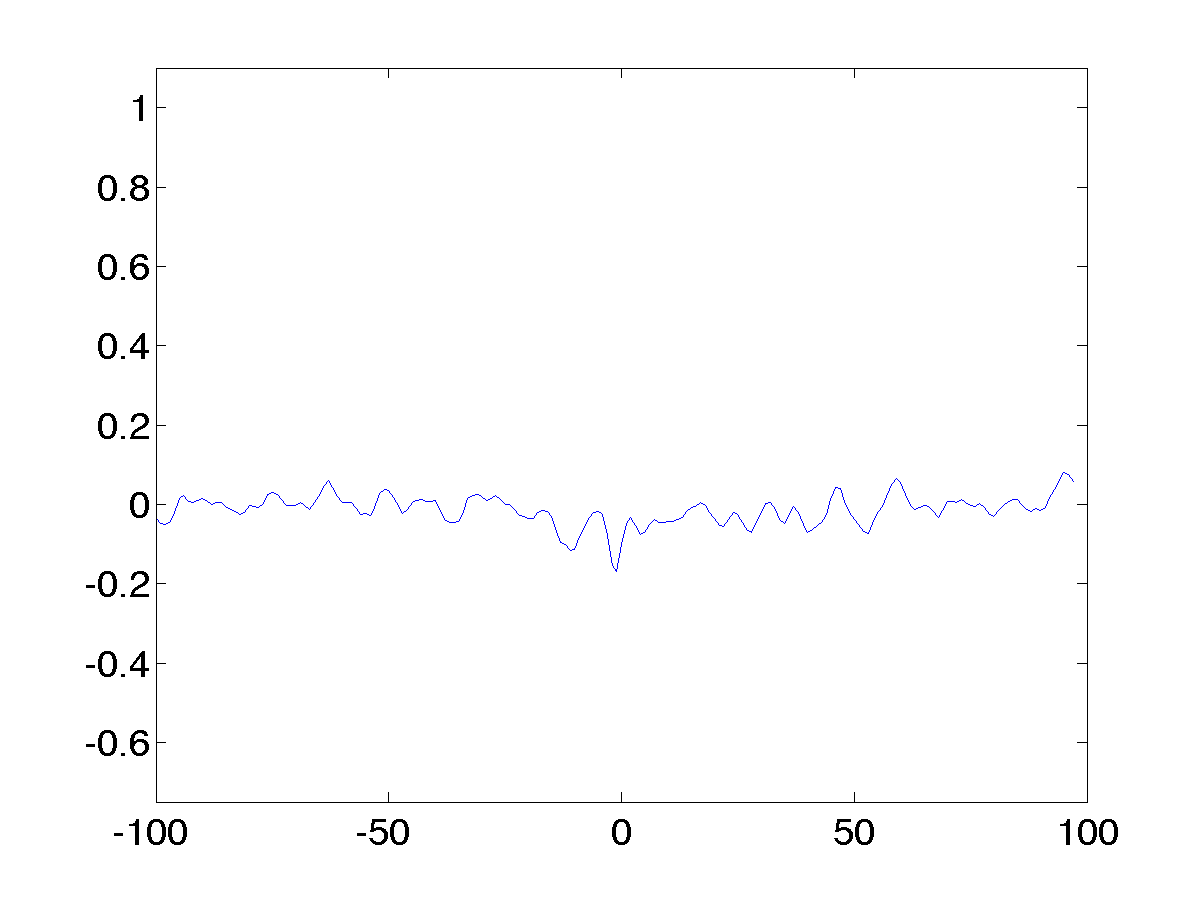
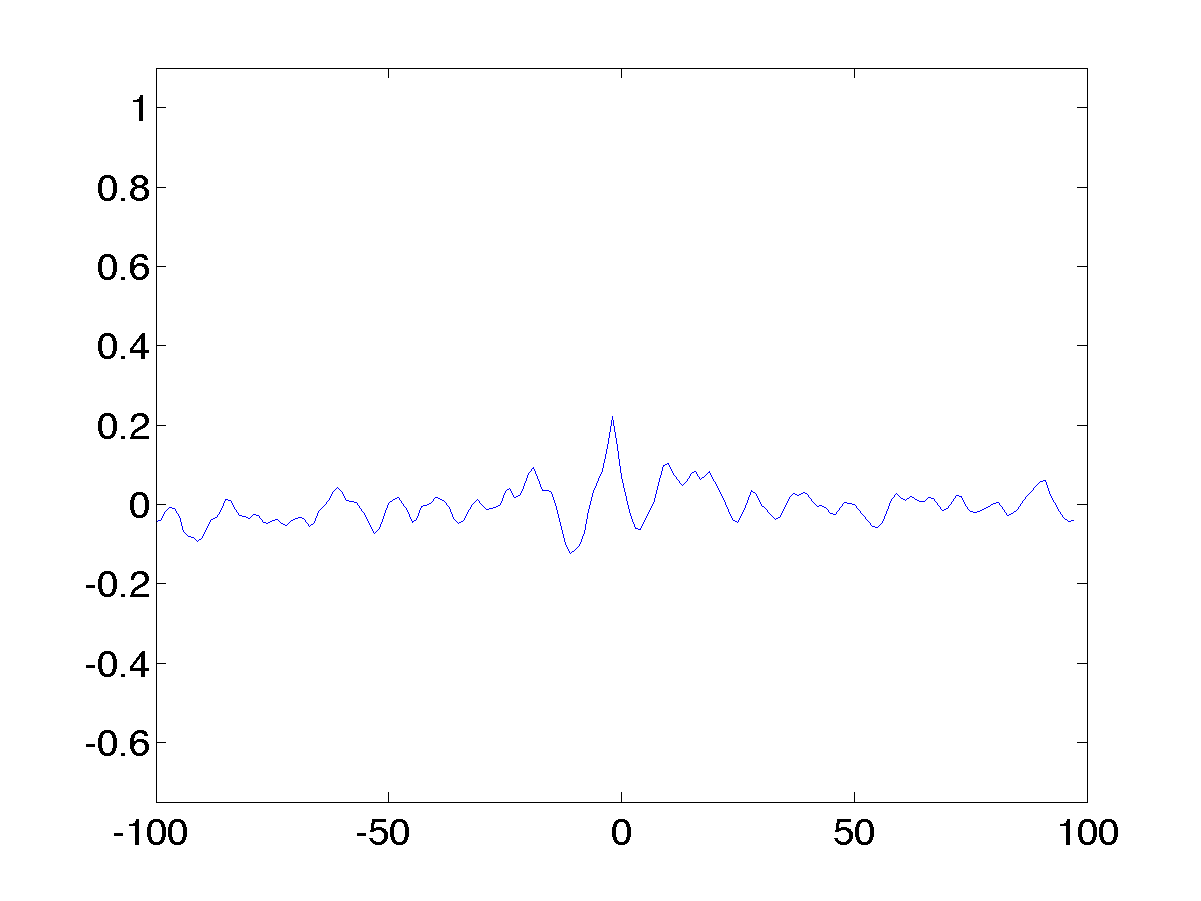
The plots show functions representing the trimers (AAA,...TTT). Function values are plotted versus position. All values are normalised, i.e. they are relative values with respect to the global maximum over all functions which is 1.0.
| nr | oligomer | peak-position | peak-value | plot |
|---|---|---|---|---|
| 1 | AAA | 9 | 0.1943 | AAA-Plot |
| 2 | AAC | 6 | -0.1359 | AAC-Plot |
| 3 | AAG | -12 | 0.3173 | AAG-Plot |
| 4 | AAT | -18 | 0.1510 | AAT-Plot |
| 5 | ACA | -2 | 0.1435 | ACA-Plot |
| 6 | ACC | -11 | -0.1007 | ACC-Plot |
| 7 | ACG | -10 | -0.0954 | ACG-Plot |
| 8 | ACT | -30 | -0.0942 | ACT-Plot |
| 9 | AGA | -10 | 0.2961 | AGA-Plot |
| 10 | AGC | -14 | -0.0811 | AGC-Plot |
| 11 | AGG | -11 | 0.8124 | AGG-Plot |
| 12 | AGT | -1 | -0.1420 | AGT-Plot |
| 13 | ATA | -6 | 0.1210 | ATA-Plot |
| 14 | ATC | 70 | -0.1236 | ATC-Plot |
| 15 | ATG | 0 | 1.0000 | ATG-Plot |
| 16 | ATT | -1 | -0.2440 | ATT-Plot |
| 17 | CAA | -10 | -0.1957 | CAA-Plot |
| 18 | CAC | -11 | -0.1007 | CAC-Plot |
| 19 | CAG | -13 | 0.1534 | CAG-Plot |
| 20 | CAT | -1 | 0.3551 | CAT-Plot |
| 21 | CCA | -11 | -0.1210 | CCA-Plot |
| 22 | CCC | -87 | -0.0877 | CCC-Plot |
| 23 | CCG | -8 | -0.0866 | CCG-Plot |
| 24 | CCT | -9 | -0.0954 | CCT-Plot |
| 25 | CGA | 47 | 0.0771 | CGA-Plot |
| 26 | CGC | -10 | -0.1346 | CGC-Plot |
| 27 | CGG | 8 | -0.1178 | CGG-Plot |
| 28 | CGT | -12 | -0.1150 | CGT-Plot |
| 29 | CTA | -2 | 0.1789 | CTA-Plot |
| 30 | CTC | 55 | 0.0770 | CTC-Plot |
| 31 | CTG | -6 | -0.1494 | CTG-Plot |
| 32 | CTT | -12 | -0.1084 | CTT-Plot |
| 33 | GAA | -8 | 0.1801 | GAA-Plot |
| 34 | GAC | -13 | 0.0869 | GAC-Plot |
| 35 | GAG | -10 | 0.8643 | GAG-Plot |
| 36 | GAT | 2 | -0.1894 | GAT-Plot |
| 37 | GCA | -11 | -0.1365 | GCA-Plot |
| 38 | GCC | 13 | -0.1083 | GCC-Plot |
| 39 | GCG | 7 | -0.1578 | GCG-Plot |
| 40 | GCT | -12 | -0.1342 | GCT-Plot |
| 41 | GGA | -11 | 0.8832 | GGA-Plot |
| 42 | GGC | 2 | 0.1692 | GGC-Plot |
| 43 | GGG | -11 | 0.2701 | GGG-Plot |
| 44 | GGT | -1 | -0.2580 | GGT-Plot |
| 45 | GTA | -7 | 0.0772 | GTA-Plot |
| 46 | GTC | 2 | 0.1400 | GTC-Plot |
| 47 | GTG | 0 | -0.5527 | GTG-Plot |
| 48 | GTT | -1 | -0.2177 | GTT-Plot |
| 49 | TAA | -18 | 0.1867 | TAA-Plot |
| 50 | TAC | -11 | -0.0842 | TAC-Plot |
| 51 | TAG | 31 | 0.0506 | TAG-Plot |
| 52 | TAT | -1 | 0.4246 | TAT-Plot |
| 53 | TCA | -2 | -0.1809 | TCA-Plot |
| 54 | TCC | -10 | -0.0855 | TCC-Plot |
| 55 | TCG | -19 | -0.1351 | TCG-Plot |
| 56 | TCT | 29 | -0.0662 | TCT-Plot |
| 57 | TGA | 1 | 0.1353 | TGA-Plot |
| 58 | TGC | 1 | -0.3015 | TGC-Plot |
| 59 | TGG | -3 | -0.1634 | TGG-Plot |
| 60 | TGT | -1 | -0.1695 | TGT-Plot |
| 61 | TTA | -2 | 0.2207 | TTA-Plot |
| 62 | TTC | -11 | -0.1142 | TTC-Plot |
| 63 | TTG | 0 | -0.6734 | TTG-Plot |
| 64 | TTT | -1 | -0.2053 | TTT-Plot |