Image Matrix of Learnt Oligo Functions
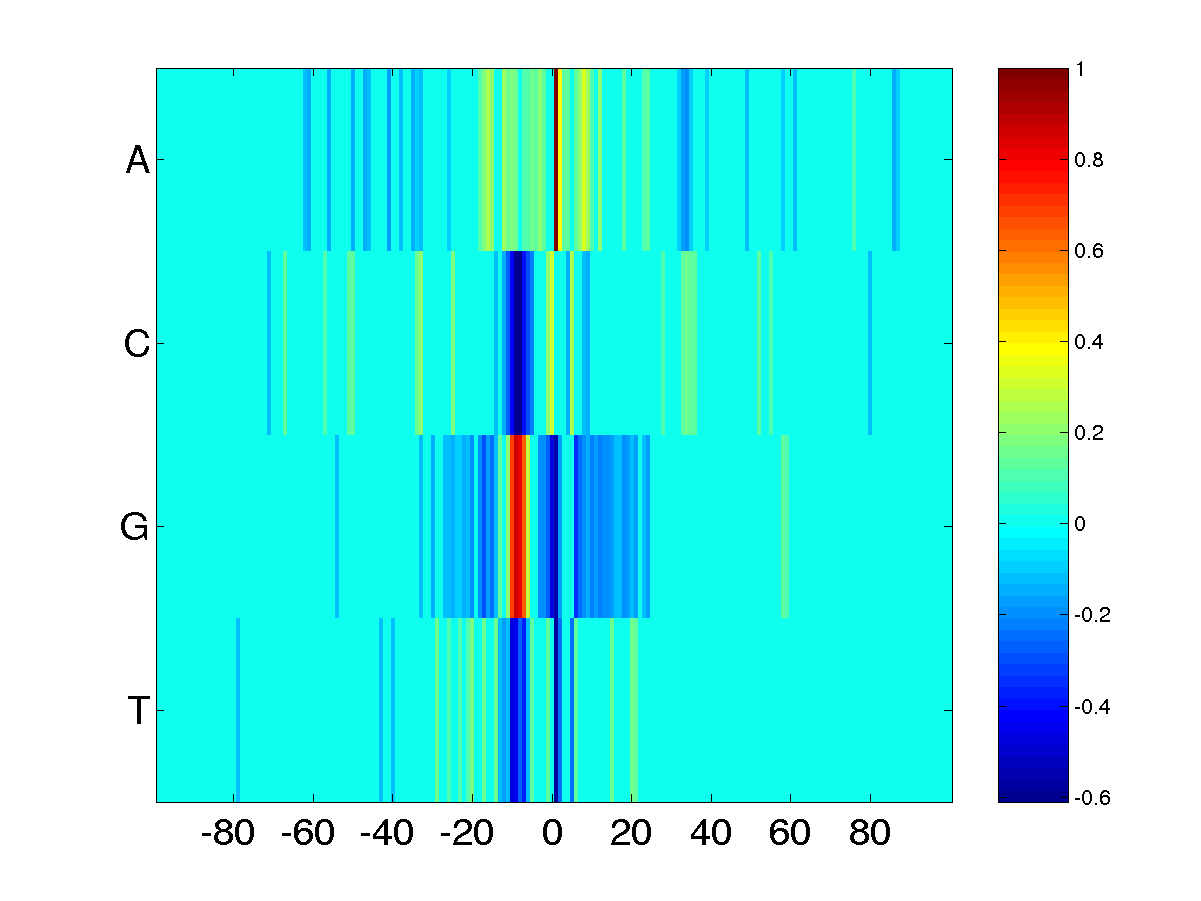
The plot shows the image matrix of learnt oligo functions derived from the Monomer Kernel. Each of the 4 lines shows one 1-mer function obtained from an average over 50 runs. Each of the 200 columns corresponds to a certain position with 0 indicating the position of the start codon. The function values are visualized by the color of the corresponding matrix elements. The complete matrix of function values has been scaled to yield a unit maximum which is located at the A line at position 0. For noise reduction all matrix elements with an absolute value below 0.1 have been zeroed.
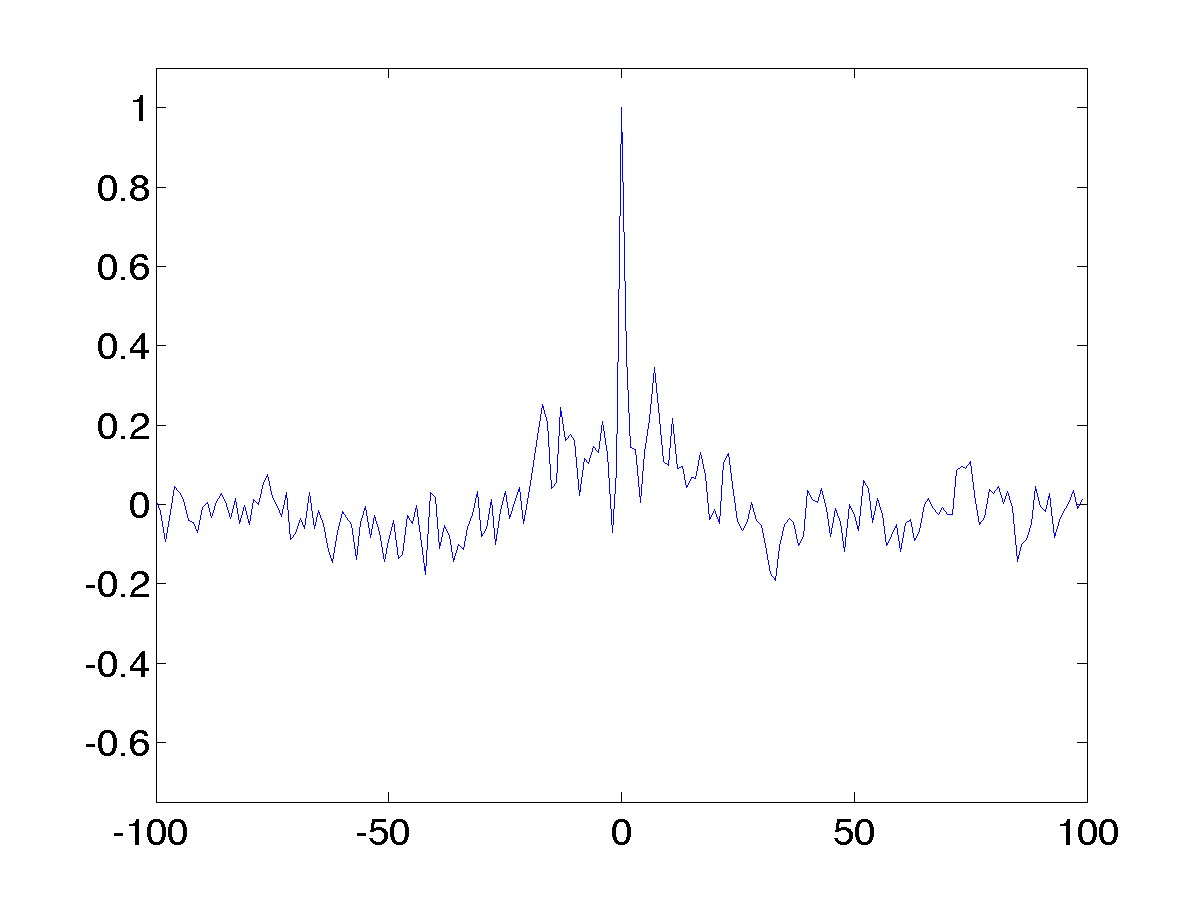
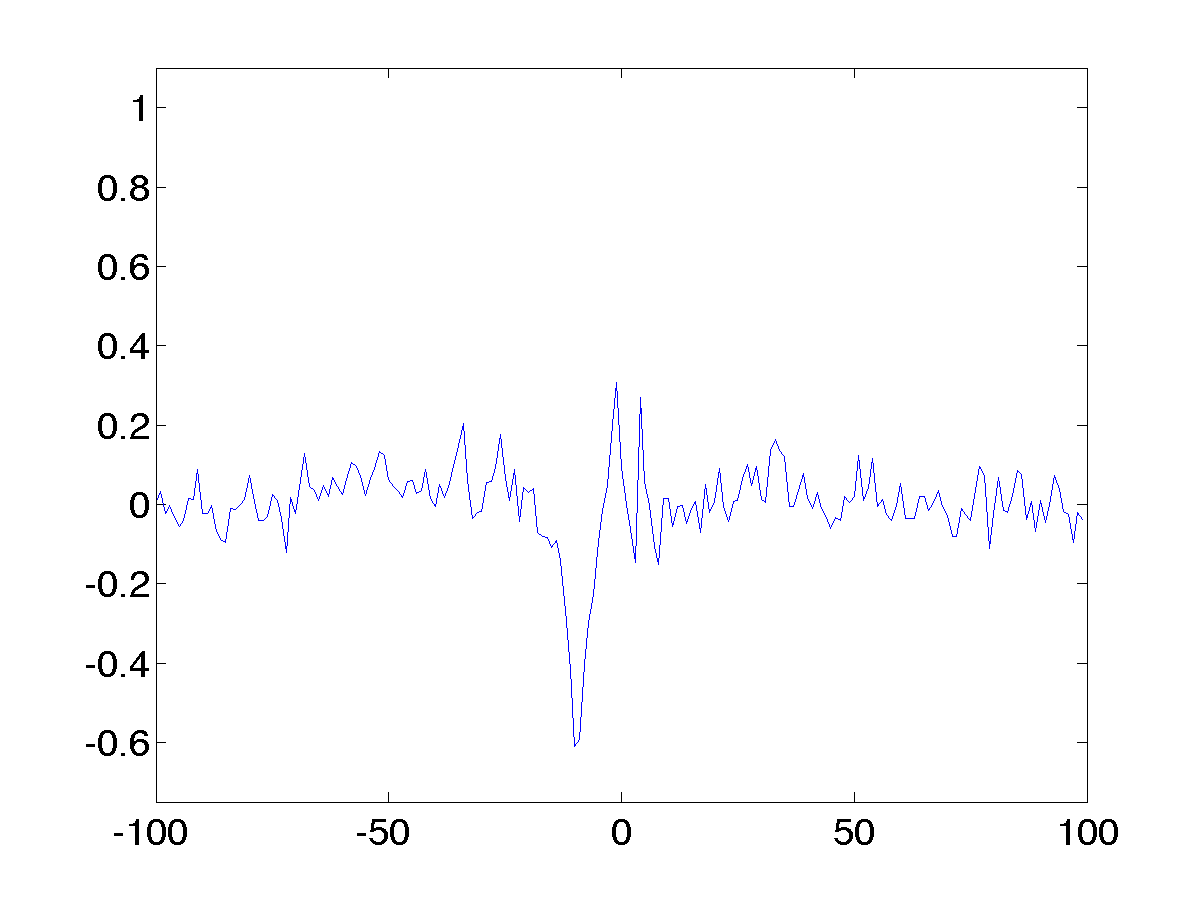
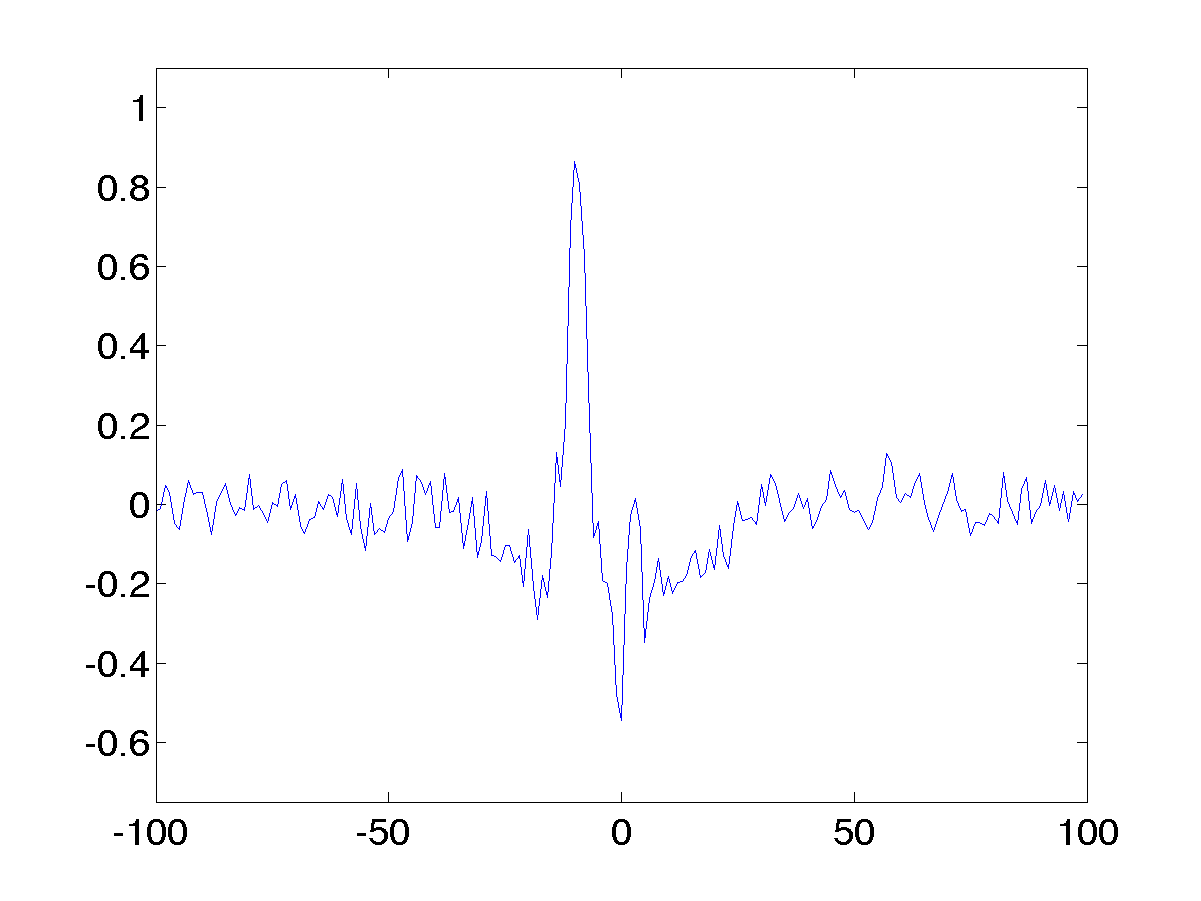
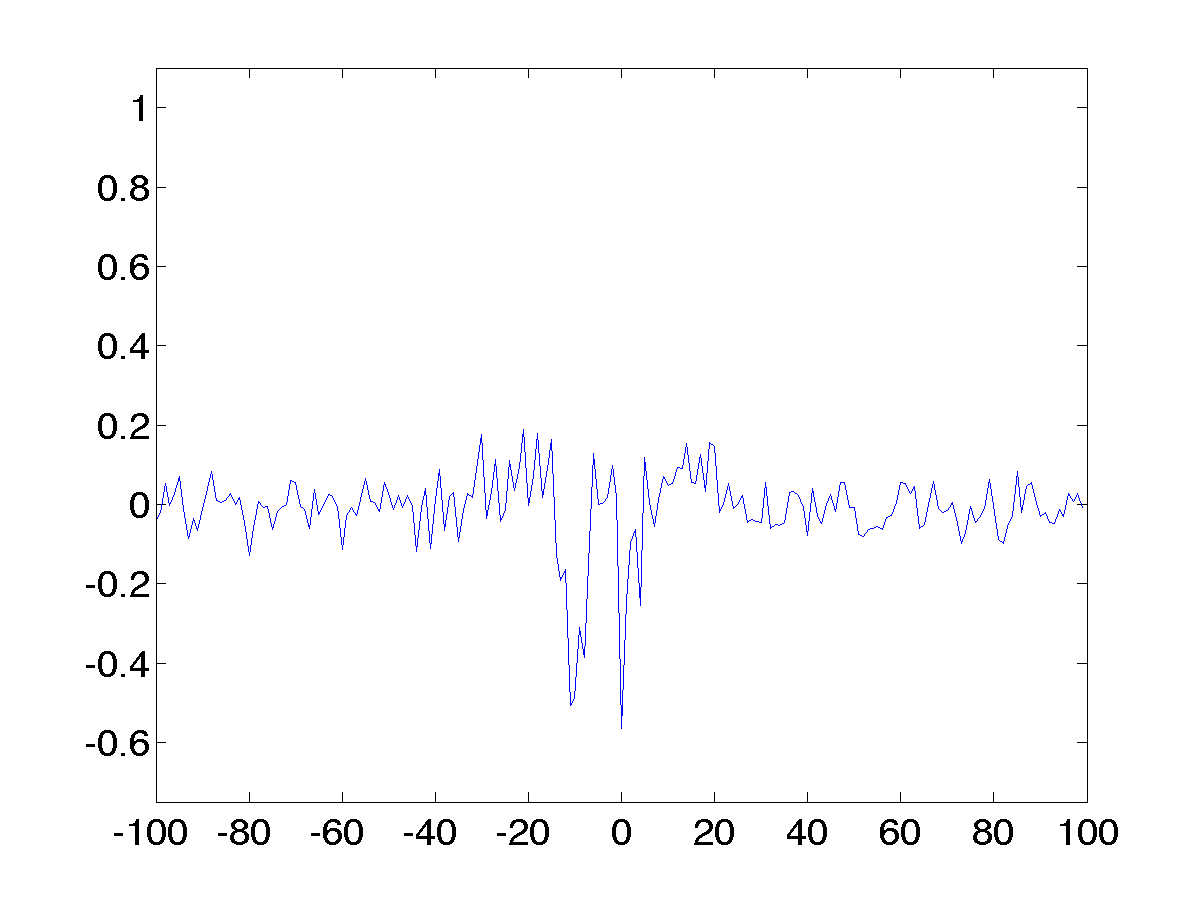
Plots of the Monomer Functions
The plots show functions representing the monomers (A, C, T, G). Function values are plotted versus position. All values are normalised, i.e. they are relative values with respect to the global maximum over all functions which is 1.0.
| nr | oligomer | peak-position | peak-value | plot |
|---|---|---|---|---|
| 1 | A | 0 | 1 | A-Plot |
| 2 | C | -10 | -0.6598 | C-Plot |
| 3 | G | -10 | 0.9614 | G-Plot |
| 4 | T | 0 | -0.5636 | T-Plot |